|

Gold Price Forecast: XAU/USD on its way to retest record highs

XAU/USD Current price: $2,653.70

  • Market players started the new year, dropping high-yielding assets amid persistent uncertainty.
  • Central banks’ hawkishness and political uncertainty undermine the market’s mood.
  • XAU/USD is reaching overbought conditions in the near term, but buyers are unlikely to give up.
Spot Gold trades around $2,650 a troy ounce as market players slowly return to their desks in the New Year holiday aftermath. Investors started the year dropping high-yielding assets, expressing their concerns about what the new year may bring.

Speculation that central banks may keep slowing the pace of interest rate cuts amid stubborn inflation are among the main themes. Geopolitical tensions are also at the top of the list after Ukraine interrupted the flow of Russian gas to several European countries after a former agreement ended on New Year’s Day, with Ukraine refusing to renew it.

Meanwhile, a risk-averse environment dominates the scenes. United States (US) indexes started the day with a positive tone but quickly dipped in the red, sending investors into safe-haven Gold.

XAU/USD short-term technical outlook

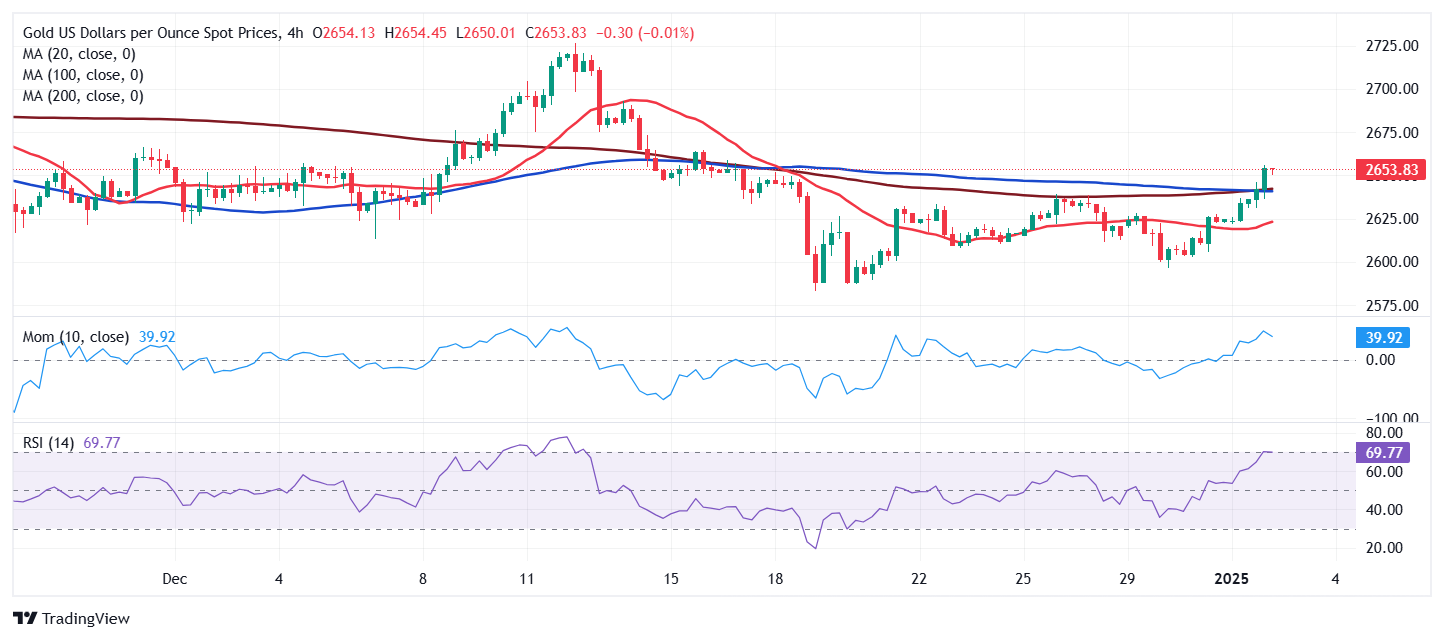
XAU/USD peaked at $2,655.68 and holds nearby in the mid-American session. From a technical point of view, the daily chart shows that the positive momentum is not enough to confirm additional gains, yet also that bulls dominate the bright metal. XAU/USD currently trades above all its moving averages, recovering above a flat 20 Simple Moving Average (SMA) after finding buyers around a bullish 100 SMA. Technical indicators, in the meantime, have pared their slides and turned marginally higher, albeit with uneven strength and still far from reflecting strong buying interest.

In the near term, and according to the 4-hour chart, however, XAU/USD is firmly bullish. The Momentum indicator heads north almost vertically well above its 100 line, while the Relative Strength Index (RSI) indicator advances around 70. Finally, the pair has moved above all its moving averages, although they lack directional strength. Gold needs to settle above $2,664.27, December 16 high, to convince speculative interest it could re-test record highs.

Support levels:  2,639.15 2,621.60 2,607.30

Resistance levels: 2,664.30 2,678.85 2,691.60


Author

Valeria Bednarik

Valeria Bednarik was born and lives in Buenos Aires, Argentina. Her passion for math and numbers pushed her into studying economics in her younger years.


More from Valeria Bednarik
Share:

Editor's Picks

GBP/USD turns negative; slips back to 1.3530

GBP/USD comes under pressure and weakens toward the 1.3530 zone on Tuesday. Cable thus leaves behind two daily upticks in a row and retreats further from Monday’s multi-week tops past 1.3570 following humble gains in the Greenback and disheartening UK jobs data.

EUR/USD comes under pressure near 1.1570

EUR/USD could not sustain the earlier bullish attempt toward the proximity of 1.1600 the figure, coming under fresh downside pressure and revisiting the 1.1580-1.1570 band as the NA session draws to a close on Tuesday. The better tone in the US Dollar in the latter part of the day weighs on the pair amid steady volatility in the Middle East. Looking forward, the release of the FOMC Minutes takes centre stage on Wednesday.

Gold remains offered around $4,350

Gold accelerates its daily correction and revisits the $4,350 zone per troy ounce on Tuesday. The precious metal sets aside two daily advances in a row and follows the absence of direction in the US Dollar, declining US Treasury yields across the curve and continuous uncertainty in the Middle East crisis.

Bitcoin volatility falls below Nasdaq as market activity hits multi-year low

Bitcoin’s 30-day volatility has fallen below that of the Nasdaq for only the fifth time on record, as subdued trading activity and declining volumes point to an unusually quiet period, according to a Tuesday report from K33. BTC's 30-day volatility has dropped to 1.132%, marking its fourth-lowest reading of the 2020s. Seven-day volatility also dropped to 0.52%, its lowest level since 2023.

Fiscal concerns and doubts on Fed independence send US yields to long-term highs

US Treasury yields keep rising across the curve this week, with the yield for the 30-year Treasury bond reaching its highest level since 2007, during the global financial crisis, at 5.33% so far on Monday. A mix of concerns about the ballooning US fiscal deficit and growing doubts about the Federal Reserve’s Independence are increasing pressure on US Government Bonds.

Why is Crude Oil priced for a reopening the ships haven't made?
Fourteen vessels crossed the Strait of Hormuz on Tuesday. Before the war, the count ran near 120 a day. In the sessions since the waterway was publicly declared open, Brent has drifted back to $87 and West Texas Intermediate (WTI) to $81, both a little lower again on Wednesday, with daily momentum on each unwound from the top of its range in late July to the low twenties now.














