Gold Price Forecast: XAU/USD needs a soft US CPI inflation report to take on the $2,500 level
- Gold price defends $2,450, as buyers stay hopeful ahead of key US CPI data.
- The US Dollar and Treasury bond yields lick soft PPI data-inflicted wounds.
- Gold price teases upside break from a symmetrical triangle amid a daily bullish RSI.

Gold price is defending the $2,450 psychological level, looking to the one-week high of $2,477 on the US Consumer Price Index (CPI) inflation day.
All eyes remain on the key US CPI inflation data
Gold buyers remain expectant of a softer US CPI report, following a bigger-than-expected cool-off in the Producer Price Index (PPI) inflation data published a day ago.
The US will hog attention later on Tuesday while the US Consumer Price Index (CPI) inflation release will stand out on Wednesday. The US Labor Department’s Bureau of Labor Statistics reported Tuesday that the headline PPI increased 2.2%, a sharp drop from the 2.7% reading in June, coming in below the expected 2.3% rise.
The data triggered a risk rally on Wall Street, as it reinforced dovish US Federal Reserve (Fed) expectations, smashing the US Dollar across the board in tandem with the US Treasury bond yields. Increased dovish Fed bets cushioned the corrective downside in the non-interest-bearing Gold price, as markets resorted to profit-taking after the bright metal reverted toward all-time highs in the lead-up to the US CPI showdown.
Markets are currently pricing in a 54% chance of a 50 basis points (bps) interest-rate cut by the Fed in September, according to the CME Group’s FedWatch Tool.
Meanwhile, the US annual CPI is seen rising 2.9% in July, compared to the 3% figure recorded in June. The annual core CPI inflation is set to ease to 3.2% in the same period vs. June’s 3.3%. Over the month, the CPI is expected to rebound 0.2% in July while the core CPI will likely inch a tad higher to 0.2%.
A softer-than-expected headline annual CPI print could confirm bets of aggressive and big Fed rate cuts, providing extra legs to the US Dollar downtrend. Gold price, in turn, could clinch fresh record highs.
Besides, Gold price will continue to find support from the rife Middle East geopolitical tensions, with markets bracing for an imminent Iranian attack on Israel. Additionally, speeches from Fed policymakers will also help influence the Gold price action.
Gold price technical analysis: Daily chart
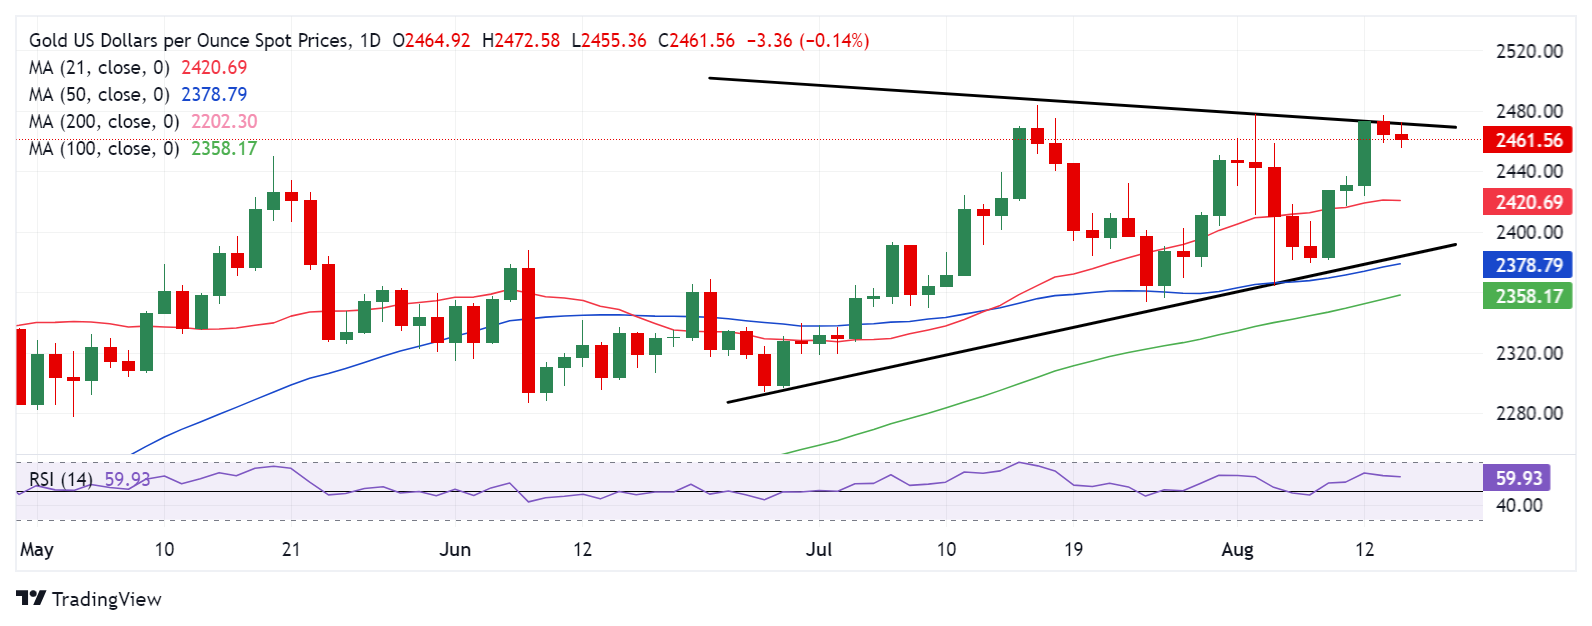
As observed on the daily chart, Gold price is challenging the upper boundary of a symmetrical triangle formation, now at $2,471.
Gold buyers look to the US CPI data to secure a daily candlestick closing above that level, which could then trigger a fresh advance to the $2,500 mark.
However, Gold price needs to take out the all-time high of $2,484, at first.
The key leading indicator, the 14-day Relative Strength Index (RSI) points lower but stays above the 50 level, suggesting that Gold price will continue to see dip demand.
On the other hand, an upside surprise in the US CPI data could revive the selling interest, dragging Gold price back toward the 21-day Simple Moving Average (SMA) support at $2,420 holds.
Ahead of that, the August 9 high of $2,437 could lend some support to Gold buyers.
Should the selling momentum intensify, with the 21-day SMA giving way, the next relevant support is seen at $2,380, where the lower boundary of the triangle and the 50-day SMA converge.
Economic Indicator
Consumer Price Index (YoY)
Inflationary or deflationary tendencies are measured by periodically summing the prices of a basket of representative goods and services and presenting the data as The Consumer Price Index (CPI). CPI data is compiled on a monthly basis and released by the US Department of Labor Statistics. The YoY reading compares the prices of goods in the reference month to the same month a year earlier.The CPI is a key indicator to measure inflation and changes in purchasing trends. Generally speaking, a high reading is seen as bullish for the US Dollar (USD), while a low reading is seen as bearish.
Read more.Next release: Wed Aug 14, 2024 12:30
Frequency: Monthly
Consensus: 2.9%
Previous: 3%
Source: US Bureau of Labor Statistics
The US Federal Reserve has a dual mandate of maintaining price stability and maximum employment. According to such mandate, inflation should be at around 2% YoY and has become the weakest pillar of the central bank’s directive ever since the world suffered a pandemic, which extends to these days. Price pressures keep rising amid supply-chain issues and bottlenecks, with the Consumer Price Index (CPI) hanging at multi-decade highs. The Fed has already taken measures to tame inflation and is expected to maintain an aggressive stance in the foreseeable future.
Premium
You have reached your limit of 3 free articles for this month.
Start your subscription and get access to all our original articles.
Author

Dhwani Mehta
FXStreet
Residing in Mumbai (India), Dhwani is a Senior Analyst and Manager of the Asian session at FXStreet. She has over 10 years of experience in analyzing and covering the global financial markets, with specialization in Forex and commodities markets.


