Gold Price Forecast: XAU/USD nears $2,650 without looking back

XAU/USD Current price: $2,646.50
- Market players lifted bets of another 50 bps rate cut by the Federal Reserve.
- United States data surprised negatively, hurting demand for the US Dollar.
- XAU/USD trades at fresh record highs without signs of giving up.
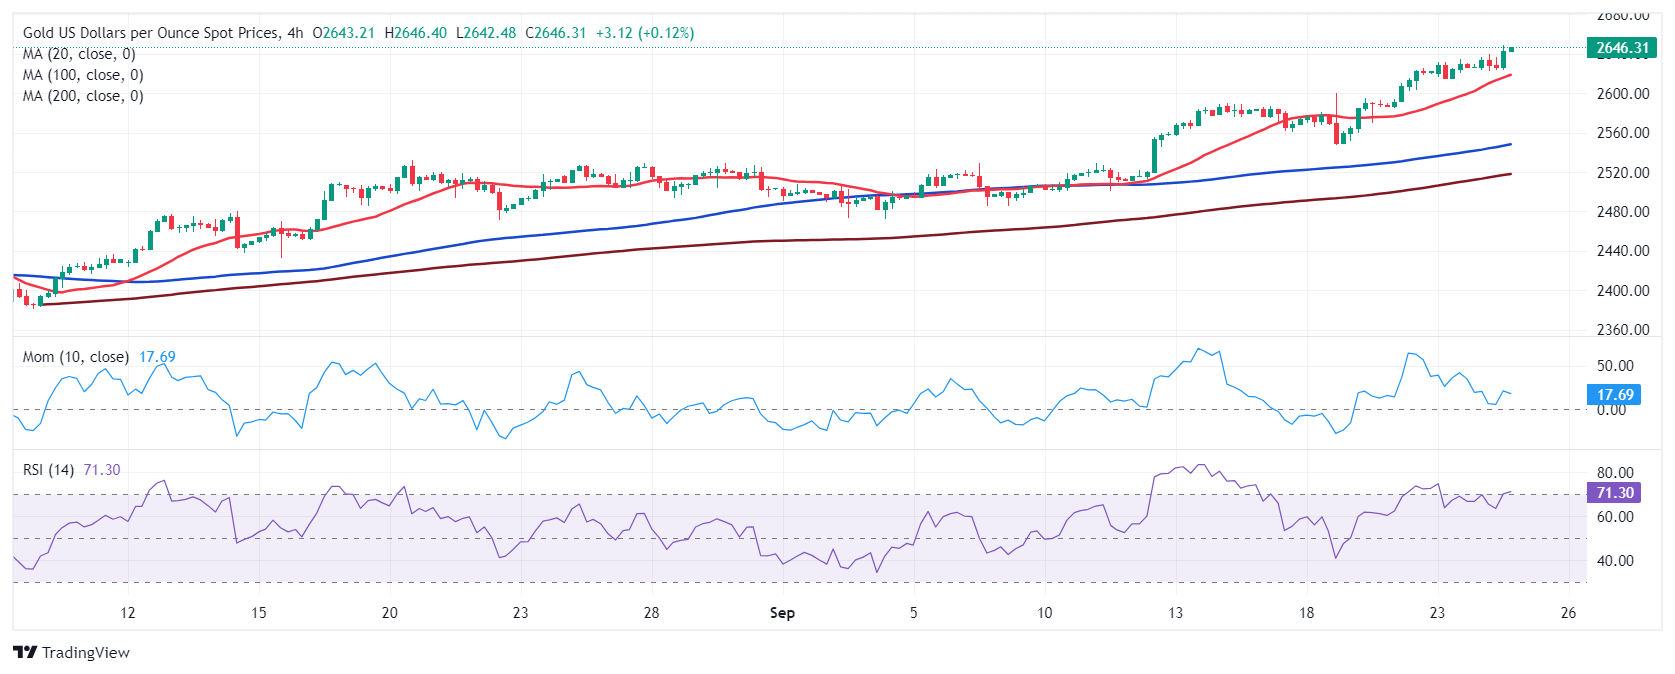
Gold price hit yet another record high on Tuesday, changing hands as high as $2,639.99 a troy ounce during Asian trading hours, to break higher after Wall Street’s opening. The absence of relevant macroeconomic releases left financial markets without a fresh directional catalyst throughout the first half of the day, although the prevalent US Dollar’s weakness kept XAU/USD on the bullish side.
The bright metal extended gains beyond the $2,640 mark during the American session and after the release of discouraging United States (US) data. Consumer sentiment in the country deteriorated in September, with The Conference Board's (CB) Consumer Confidence Index falling to 98.7 in September after printing at 105.6 in August. Even further, the Present Situation Index fell by 10.3 points to 124.3, while the Expectations Index declined by 4.6 points to 81.7 but remained above 80. Readings below it usually anticipate a recession. As a result, market participants lifted bets the Federal Reserve (Fed) could trim interest rates by 50 basis points (bps) once again in November.
Other than that, the Richmond Fed Manufacturing Index contracted to -21 in September from the previous -19 while missing the -17 anticipated. The macroeconomic calendar will remain scarce on Wednesday, with the focus moving to the end of the week when the US will release the August Personal Consumption Expenditures (PCE) Price Index.
XAU/USD short-term technical outlook
XAU/USD trades around $2,645 with no signs of giving up. In the daily chart, the pair keeps posting higher highs and higher lows, while technical indicators maintain modest bullish slopes within overbought levels. At the same time, the pair develops far above bullish moving averages, with the 20 Simple Moving Average (SMA) now hovering at around $2,545.
The near-term picture also skews the risk to the upside, although some timid divergences anticipate a potential corrective slide. In the 4-hour chart, moving averages accelerated north far below the current level, in line with continued buying interest. However, the Momentum indicator keeps grinding lower in positive territory, diverging from price action. Finally, the Relative Strength Index (RSI) indicator maintains the positive bias, advancing near overbought readings just ahead of overbought readings.
Support levels: 2,628.10 2,613.50 2,598.10
Resistance levels: 2,650.00 2,675.00 2,690.00
Author

Valeria Bednarik
FXStreet
Valeria Bednarik was born and lives in Buenos Aires, Argentina. Her passion for math and numbers pushed her into studying economics in her younger years.