Gold Price Forecast: XAU/USD looks to US PMI data, with triangle breakout in play
- Gold price holds recent gains early Friday, on track for the second weekly gain in a row.
- The US Dollar stays elevated with Treasury bond yields ahead of key PMI data.
- Gold price confirms a symmetrical triangle breakout on Thursday, as the daily RSI holds above 50.

Gold price is consolidating weekly gains near the highest level in nine days at $2,366, despite the US Dollar sticking to its recovery momentum alongside the US Treasury bond yields. Gold price looks forward to the preliminary business PMI data from both sides of the Atlantic for a fresh trading impetus.
Gold price keenly awaits global PMI data
Gold price remains on track to book the second weekly gain in a row, notwithstanding the late rebound in the US Dollar, as buyers continue to cheer increased interest rate cut bets by the US Federal Reserve (Fed) in September.
Data released on Thursday pointed to a slowing US economy, as Initial Jobless Claims declined 5,000 to a seasonally adjusted 238,000 for the week ended June 15, retreating from a ten-month high. Meanwhile, Housing Starts fell 5.5% to a seasonally adjusted annual rate of 1.277 million units last month, the lowest since June 2020, below the expected 1.37 million units.
Signs of cooling US labor and housing market keep the hopes for a September Fed rate cut alive and kicking, benefiting the non-interest-bearing Gold price.
Additionally, a rate reduction by the Swiss National Bank (SNB) for the second consecutive meeting on Thursday, following the rate cuts deployed by the Bank of Canada (BoC) and the European Central Bank (ECB) reinforced the narrative that the era of lower borrowing costs is already underway, helping keep Gold price afloat amid underlying geopolitical tensions.
Gold price lures buyers as investors remain wary following the meeting between Russia’s President Vladimir Putin and North Korean leader Kim Jong Un earlier this week, as Middle East tensions continue. Gold is considered the ultimate traditional safe-haven asset.
Meanwhile, strengthening Gold demand from India, the world’s second-largest Gold consumer, renders positive for the bright metal. “Gold buying exceeded expectations leading up to the Akshaya Tritiya festival. The festival took place on May 10 and is a traditional auspicious day for gold purchases. According to the World Gold Council, buying was surprisingly strong given that prices were 23 percent higher than they were during the 2023 festival,” Mike Maharrey at Money Metals Exchange explained.
All eyes now remain on the Eurozone and the US preliminary S&P Global Manufacturing and Services PMI data, which could shed further light on the economic prospects globally, having a significant impact on risk sentiment and the US Dollar’s performance against its major counterparts. This, in turn, could affect the Gold price action, as the end-of-the-week flows and repositioning ahead of next week’s US Core Personal Consumption Expenditure (PCE) Price Index will also dominate financial markets later on Friday.
Gold price technical analysis: Daily chart
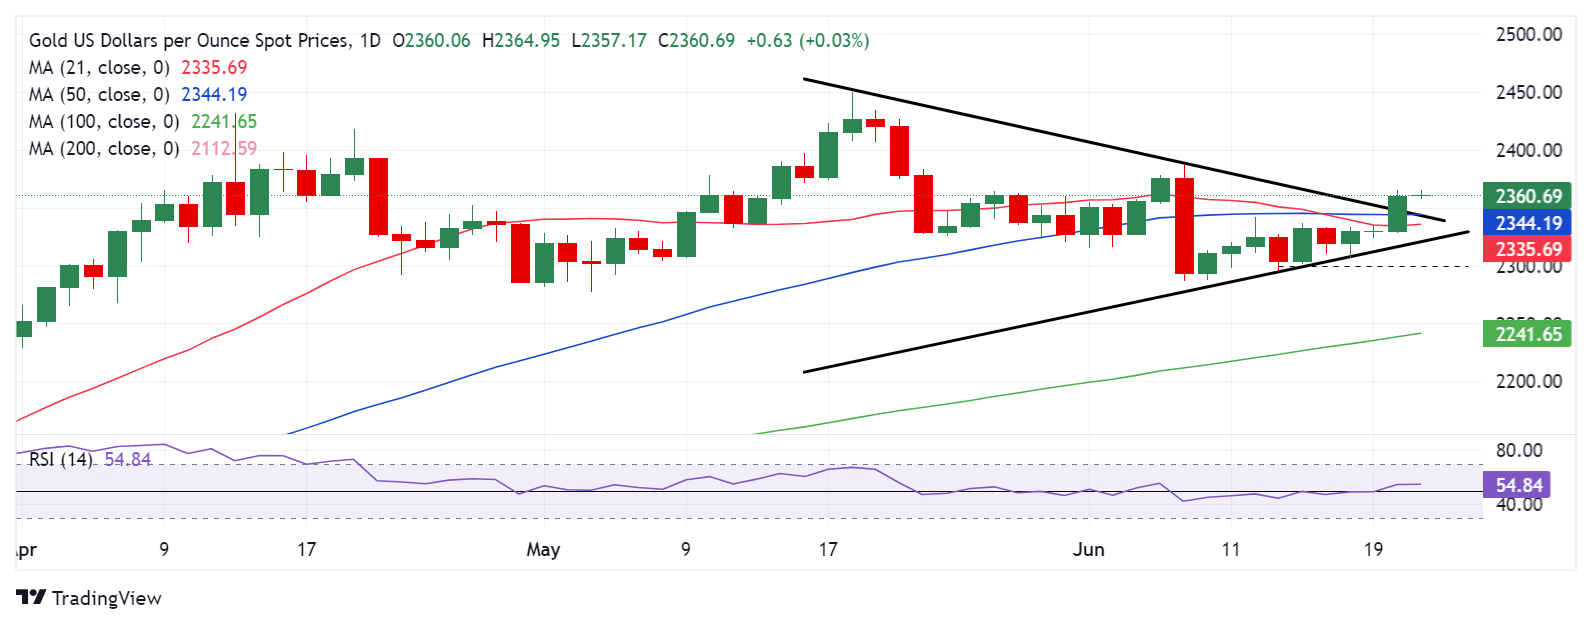
As observed on the daily chart, Gold price finally broke the range trade to the upside and closed Thursday above the critical confluence point at $2,344. That level is the intersection of the falling trendline resistance and the 50-day Simple Moving Average (SMA).
In doing so, Gold price confirmed an upside break from a month-long symmetrical triangle formation, turning the tide in favor of Gold buyers.
The 14-day Relative Strength Index (RSI) holds above the 50 level, currently near 55, suggesting that more upside remains in store.
These bullish technical indicators offset the Bear Cross validated last week after the 21-day SMA crossed the 50-day SMA from above on a daily closing basis.
Acceptance above the two-week high of $2,366 is needed to take on the next upside hurdle aligned at the June 7 high of $2,388. The last line of defense for Gold sellers is likely to be the $2,400 threshold.
If sellers fight back control then the initial demand area is seen at $2,344, the abovementioned confluence resistance-turned-support.
The 21-day SMA at $2,335 will come to the immediate rescue of Gold buyers. A sustained move below that level will call for a test of the triangle support at $2,322.
Deeper declines will challenge the bullish commitments at $2,300.
Gold FAQs
Gold has played a key role in human’s history as it has been widely used as a store of value and medium of exchange. Currently, apart from its shine and usage for jewelry, the precious metal is widely seen as a safe-haven asset, meaning that it is considered a good investment during turbulent times. Gold is also widely seen as a hedge against inflation and against depreciating currencies as it doesn’t rely on any specific issuer or government.
Central banks are the biggest Gold holders. In their aim to support their currencies in turbulent times, central banks tend to diversify their reserves and buy Gold to improve the perceived strength of the economy and the currency. High Gold reserves can be a source of trust for a country’s solvency. Central banks added 1,136 tonnes of Gold worth around $70 billion to their reserves in 2022, according to data from the World Gold Council. This is the highest yearly purchase since records began. Central banks from emerging economies such as China, India and Turkey are quickly increasing their Gold reserves.
Gold has an inverse correlation with the US Dollar and US Treasuries, which are both major reserve and safe-haven assets. When the Dollar depreciates, Gold tends to rise, enabling investors and central banks to diversify their assets in turbulent times. Gold is also inversely correlated with risk assets. A rally in the stock market tends to weaken Gold price, while sell-offs in riskier markets tend to favor the precious metal.
The price can move due to a wide range of factors. Geopolitical instability or fears of a deep recession can quickly make Gold price escalate due to its safe-haven status. As a yield-less asset, Gold tends to rise with lower interest rates, while higher cost of money usually weighs down on the yellow metal. Still, most moves depend on how the US Dollar (USD) behaves as the asset is priced in dollars (XAU/USD). A strong Dollar tends to keep the price of Gold controlled, whereas a weaker Dollar is likely to push Gold prices up.
Premium
You have reached your limit of 3 free articles for this month.
Start your subscription and get access to all our original articles.
Author

Dhwani Mehta
FXStreet
Residing in Mumbai (India), Dhwani is a Senior Analyst and Manager of the Asian session at FXStreet. She has over 10 years of experience in analyzing and covering the global financial markets, with specialization in Forex and commodities markets.


