Gold Price Forecast: XAU/USD kicks off 2025 on the front foot
- Gold price extends the rebound from the $2,600 area, setting off 2025 on Thursday.
- The US Dollar stands tall amid a cautious risk tone and sluggish US Treasury bond yields.
- Gold price looks to $2,650 on a firm break above the 21-day SMA as RSI prods the 50 level.

Gold price is trading on the front foot, kicking off 2025 on Thursday. Gold buyers appear defiant amidst a broad-based US Dollar (USD) strength, targeting $2,650 on an extended rebound from the $2,600 key level.
Gold price sees a positive 2025 start
The USD benefits from a risk-averse market environment as investors remain wary of the upcoming policies from US President-elect Donald Trump and the US Federal Reserve’s (Fed) next policy action. The Fed leaned in hawkish at the December policy meeting, lifting bets for a pause in its interest-rate-cutting cycle this month.
Despite a strong Greenback, a pause in the US Treasury bond yield recovery seems to be aiding the Gold price upside, also as markets scurry for safety in the traditional safe-haven asset due to looming China’s economic concerns and geopolitical risks, mainly in the Middle East.
The expansion in China's factory activity slowed in December, Caixin PMI showed Thursday. China's Caixin Manufacturing PMI unexpectedly declined to 50.5 in December after November’s 51.5, missing the expected 51.7 figure.
Further, Gold price draws support from increased expectations of more proactive Chinese policies to promote growth in 2025. China is the world’s biggest Gold consumer.
Risk trends and the US Dollar price action will continue to drive the Gold price direction, with the moves likely to be exaggerated amid holiday-thinned markets. However, the return of the US traders after the New Year holiday break could affirm the US Dollar uptrend, capping the Gold price upbeat momentum.
The weekly US Jobless Claims data could infuse some volatility into markets as traders gear up for another eventful year.
Gold price technical analysis: Daily chart
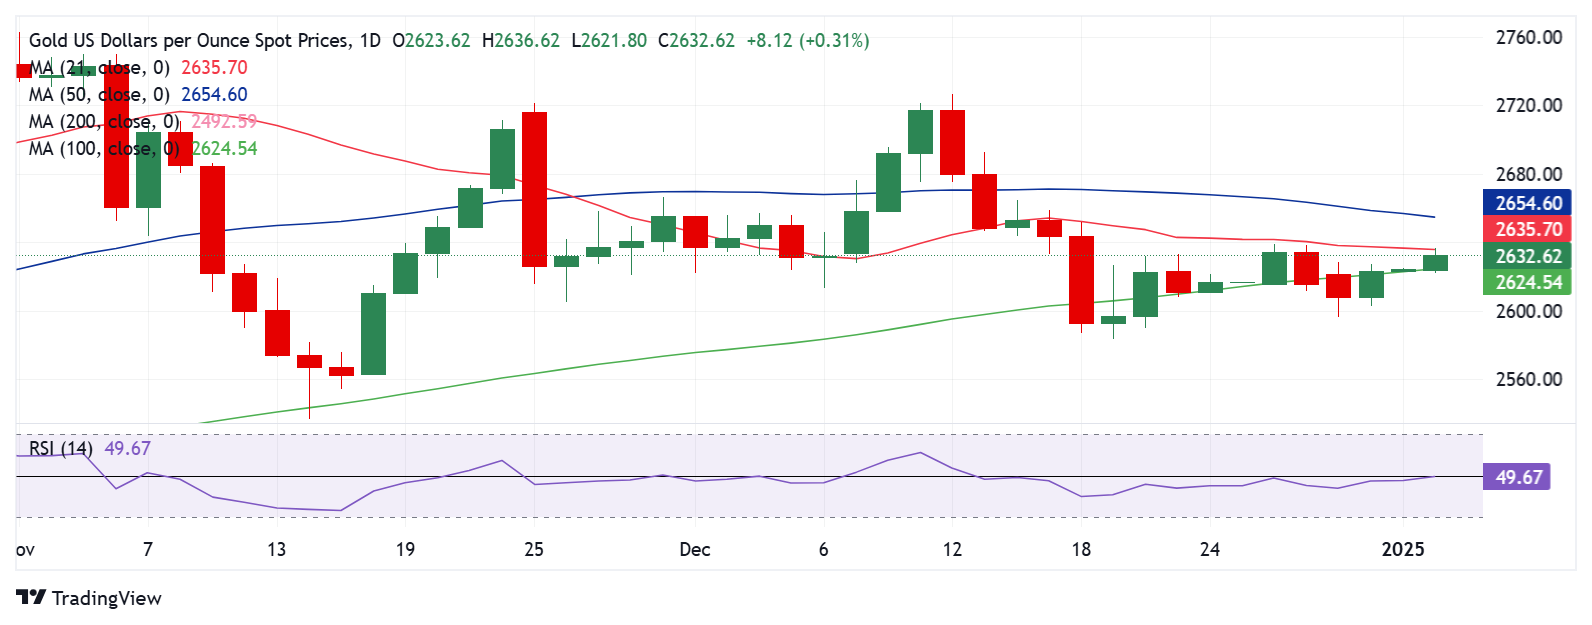
The daily chart shows that Gold price is challenging the 21-day Simple Moving Average (SMA) of $2,635 on the road to recovery.
The 14-day Relative Strength Index (RSI) prods the 50 level, failing to boost Gold price further.
Acceptance above the 21-day barrier could call for a test of the $2,650 psychological level and the 50-day SMA at $2,655.
The next relevant upside target aligns at the $2,700 round level.
On the flip side, the immediate support is at the previous resistance of 100-day SMA at $2,624.
A daily candlestick close below the latter will negate the recovery momentum, fuelling a fresh downtrend toward the weekly low of $2,596.
Further down, the December 19 low at $2,583 and the November 15 low at $2,555 could be threatened.
Gold FAQs
Gold has played a key role in human’s history as it has been widely used as a store of value and medium of exchange. Currently, apart from its shine and usage for jewelry, the precious metal is widely seen as a safe-haven asset, meaning that it is considered a good investment during turbulent times. Gold is also widely seen as a hedge against inflation and against depreciating currencies as it doesn’t rely on any specific issuer or government.
Central banks are the biggest Gold holders. In their aim to support their currencies in turbulent times, central banks tend to diversify their reserves and buy Gold to improve the perceived strength of the economy and the currency. High Gold reserves can be a source of trust for a country’s solvency. Central banks added 1,136 tonnes of Gold worth around $70 billion to their reserves in 2022, according to data from the World Gold Council. This is the highest yearly purchase since records began. Central banks from emerging economies such as China, India and Turkey are quickly increasing their Gold reserves.
Gold has an inverse correlation with the US Dollar and US Treasuries, which are both major reserve and safe-haven assets. When the Dollar depreciates, Gold tends to rise, enabling investors and central banks to diversify their assets in turbulent times. Gold is also inversely correlated with risk assets. A rally in the stock market tends to weaken Gold price, while sell-offs in riskier markets tend to favor the precious metal.
The price can move due to a wide range of factors. Geopolitical instability or fears of a deep recession can quickly make Gold price escalate due to its safe-haven status. As a yield-less asset, Gold tends to rise with lower interest rates, while higher cost of money usually weighs down on the yellow metal. Still, most moves depend on how the US Dollar (USD) behaves as the asset is priced in dollars (XAU/USD). A strong Dollar tends to keep the price of Gold controlled, whereas a weaker Dollar is likely to push Gold prices up.
Author

Dhwani Mehta
FXStreet
Residing in Mumbai (India), Dhwani is a Senior Analyst and Manager of the Asian session at FXStreet. She has over 10 years of experience in analyzing and covering the global financial markets, with specialization in Forex and commodities markets.


