Gold Price Forecast: XAU/USD firmer above $2,630

XAU/USD Current price: $2,639.05
- Speculation about upcoming US tariffs put financial markets on alert on Monday.
- The focus this week will be on the United States and employment-related data.
- XAU/USD extends its consolidative phase as bulls pause but retain control.
Spot Gold fell to $2,614.44 early in the American session but bounced from such a low and stabilized around its daily opening in the $2,630-$2,640 price zone. The US Dollar (USD) started the day with a soft tone, but came under strong selling pressure during the mid-European session amid political headlines from the United States (US).
The Washington Post reported that Donald Trump's transition team was working on narrowing tariffs, focusing only on key sectors deemed vital to national security, such as defence, medical supplies and energy, narrowing the universal tariffs plan that generated concerns. Speculative interest jumped into high-yielding assets, ignoring XAU/USD.
Still, after Wall Street’s opening, upcoming US President Donald Trump denied the headlines, saying that the story about paring back tariffs was wrong. His words boosted the USD, pushing the bright metal towards the mentioned low and putting stock markets in retreat mode.
As the dust settled, equities recovered, while the USD trimmed part of its intraday losses yet remains in the red against most major rivals. The mood remains upbeat, maintaining market players away from XAU/USD.
This week, the focus will be on US employment figures, as the country will release different figures ahead of the Nonfarm Payrolls (NFP) report, scheduled for next Friday.
XAU/USD short-term technical outlook
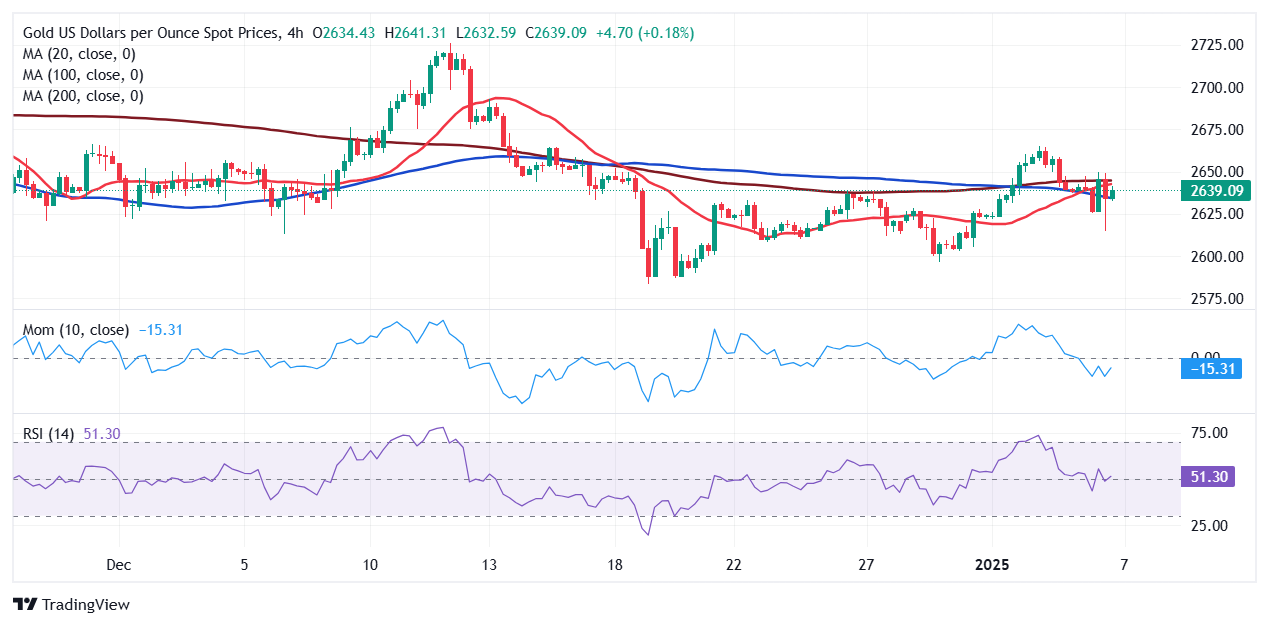
The XAU/USD pair has been trading around the current level for six weeks in a row, with spikes on one side or the other being reverted, a sign investors are comfortably waiting for a powerful catalyst to justify higher highs. In the daily chart, the bright metal hovers around a flat 20 Simple Moving Average (SMA) while buyers defended the downside at around a bullish 100 SMA, now providing dynamic support at $2,624.98. Technical indicators, in the meantime, remain within negative levels, albeit with uneven directional strength, reflecting buyers’ pause.
The near-term picture suggests the bullish potential is limited. The 20, 100 and 200 SMAs converge in a tight range in the $2,640 region, rejecting advances. Finally, technical indicators have pared their slides but remain below their midlines. Gold may turn bullish if it manages to retain gains beyond the 2,665 level, which it topped in early January.
Support levels: 2,624.90 2,611.20 2,596.00
Resistance levels: 2,649.50 2,665.10 2,678.85
Author

Valeria Bednarik
FXStreet
Valeria Bednarik was born and lives in Buenos Aires, Argentina. Her passion for math and numbers pushed her into studying economics in her younger years.


