Gold Price Forecast: XAU/USD finds acceptance above $2,670, eyes a fresh leg up on US CPI data
- Gold price sits at two-week highs near $2,700 early Wednesday, awaiting US CPI data.
- Chinese central bank buying and Middle East tensions bolster the Gold price upswing.
- Gold price finds acceptance above 50-day SMA amid a bullish RSI on the daily chart.

Gold's price is on a solid recovery, flirting with two-week highs just above $2,700 early Wednesday. However, the further upside in gold price hinges on the release of the US Consumer Price Index (CPI) data, which will likely set the pace for the US Federal Reserve’s (Fed) early next year.
Gold price stays firm as US CPI report looms
Heading into the US CPI showdown, markets are pricing in an 86% chance that the Fed will lower interest rates by 25 basis points (bps) next week, according to the CME Group’s FedWatch Tool. Meanwhile, the odds for another quarter percentage point rate reduction in January stand at 22%.
Amidst looming tariffs announced by US President-elect Donald Trump and loosening labor market conditions, the US inflation report will be critical to determining the Fed’s easing trajectory in the coming months. This will impact the value of the US Dollar (USD) and the non-yielding Gold price.
US CPI is seen rising 2.7% year-on-year (YoY) in November after reporting a 2.6% growth in October. The core annual inflation will likely remain at 3.3% in the same period. On a monthly basis, US CPI and core CPI are expected to have increased by 0.3% last month.
Gold price has witnessed an impressive recovery from eight-day lows so far this week, sitting at the highest level since November 25. This is courtesy of the ongoing Middle East geopolitical tensions and the resumption of the People’s Bank of China (PBOC) buying gold reserves.
The Chinese central bank on Saturday said it bought 160,000 fine troy ounces in November, ending a six-month pause in purchases. Meanwhile, the sudden collapse of the Syrian government over the weekend rattled markets, with investors scurrying for safety in the traditional store of value Gold price.
According to the latest developments, Israel Defense Forces (IDF) carried out attacks on Syria's naval fleet as part of its efforts to neutralise military assets in the country after the fall of the Assad regime, per BBC News.
Gold price technical analysis: Daily chart
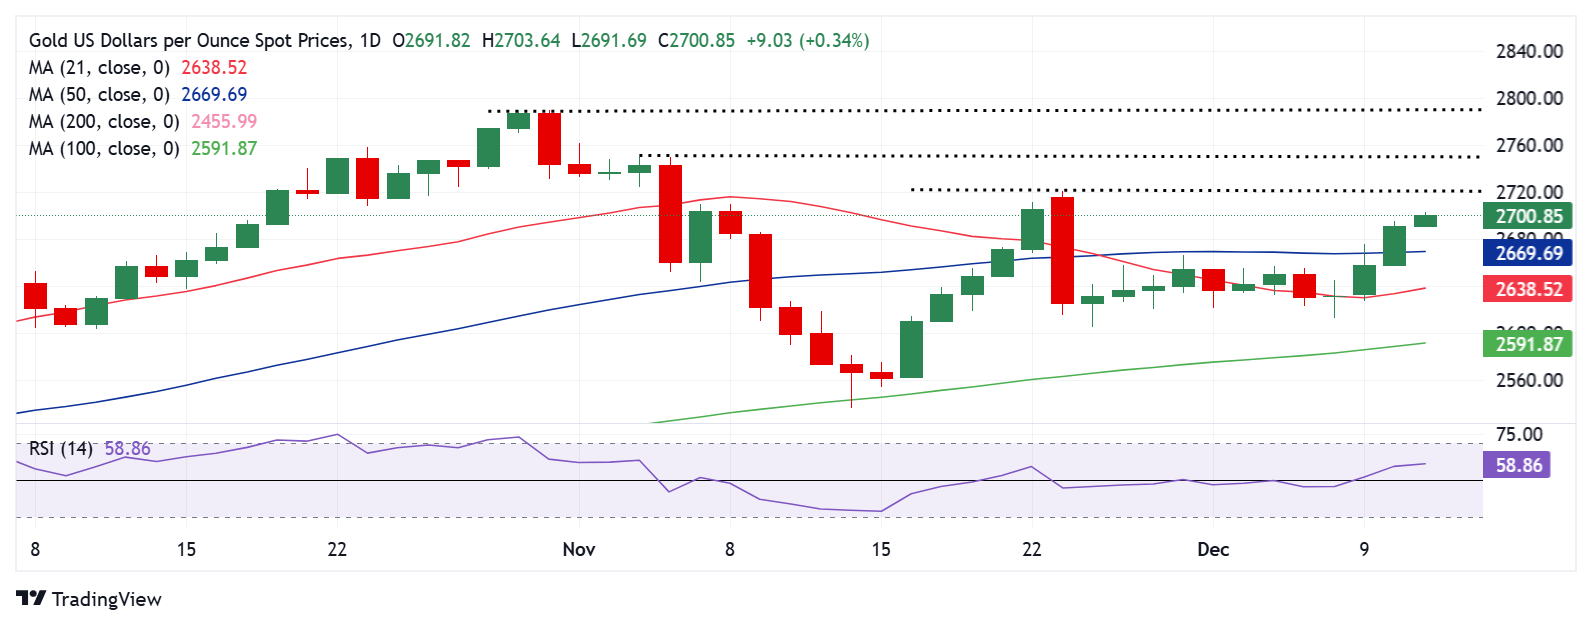
The daily chart shows that the Gold price broke the consolidative phase to the upside after recapturing the key 50-day Simple Moving Average (SMA) at $2,670 on a daily closing basis on Tuesday.
The 14-day Relative Strength Index (RSI) points north above the midline, suggesting that more gains remain in the offing.
A softer-than-expected US CPI inflation data could reinforce Fed rate cut expectations in the coming months, driving Gold price toward the November 25 high of $2,721.
The next bullish target is $2,750, the confluence of the psychological barrier and the November 5 high.
Fresh buying opportunities will likely emerge on a sustained move above the latter, calling for a test of the record high of $2,790.
In case the inflation data surprises to the upside, Gold price could face fresh headwinds, with sellers likely to test the 50-day SMA resistance-turned-support at $2,670.
The next relevant downside cap is seen at the 21-day SMA at $2,638, below which the previous week’s low of $2,613 will be challenged.
Author

Dhwani Mehta
FXStreet
Residing in Mumbai (India), Dhwani is a Senior Analyst and Manager of the Asian session at FXStreet. She has over 10 years of experience in analyzing and covering the global financial markets, with specialization in Forex and commodities markets.