Gold Price Forecast: XAU/USD eyes a fresh uptrend on a sustained move above $2,035
- Gold price regains upside traction on Thursday after a muted close on Wednesday.
- US Dollar and US Treasury bond yields stay defensive amid hawkish Fed Minutes and upbeat mood.
- Gold price awaits a firm break above $2,035, as a falling wedge breakout remains in play.

Gold price has resumed its bullish momentum near $2,030 early Thursday, having paused its recovery rally on Wednesday. A risk-on market environment is acting as a headwind for the US Dollar, despite the hawkish US Federal Reserve (Fed) January meeting Minutes.
Gold price eyes PMI data
Asian markets are trending higher, with Chinese stocks supported by the latest policy support measures and the latest ban on major institutional investors from selling equities at the open and close.
The sentiment also remains underpinned by the American tech-giant Nvidia’s encouraging earnings result, posted after the Wall Street closing bell on Wednesday. Nvidia posted $5.16 earnings per share (EPS) vs. $4.64 expected while revenue stood at $22.10 billion vs. $20.62 billion expected. The AI pioneer said that it expected $24.0 billion in sales in the current quarter.
Against a better market mood, as reflected by a 0.74% gain in the US S&P 500 futures, the US Dollar is keeping its downbeat tone intact, allowing Gold price to regain the recovery momentum.
Gold price reversed early gains on Wednesday and tested the $2,020 support area before staging a modest to close the day flat. Gold sellers returned after the Minutes of the Fed’s January meeting stated, “most participants noted the risks of moving too quickly to ease the stance of policy and emphasized the importance of carefully assessing incoming data in judging whether inflation is moving down sustainably to 2 percent.”
The Fed Minutes were read as hawkish but failed to have any lasting positive impact on the US Dollar. Therefore, Gold price managed to settle Wednesday at $2,025.
Markets are currently pricing in just about a 30% chance that the Fed could begin easing rates in May, much lower than an over 80% chance a month ago, according to the CME FedWatch Tool. For the June meeting, the probability for a rate cut now stands at 70%, down from 77% seen a day ago.
With the Fed Minutes out of the way, attention turns toward the preliminary readings of the Eurozone, UK and US business PMIs due later on Thursday. The PMI data is likely to have a significant impact on the broad market sentiment if the Eurozone PMIs indicate a potential recession while the US PMI data could squash hopes of an economic ‘soft-landing’.
That said, the further upside in the Gold price remains at the mercy of the risk sentiment, US data and Fedspeak.
Gold price technical analysis: Daily chart
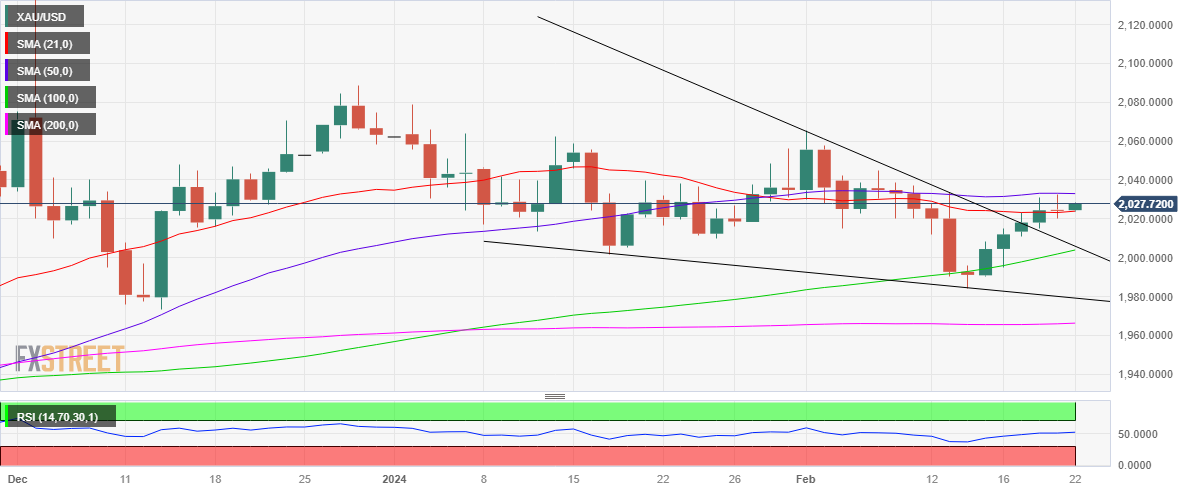
As observed on the daily chart, Gold price is consolidating the upside near multi-day highs before breaking higher through the crucial 50-day Simple Moving Average (SMA) hurdle at $2,035.
The technical setup remains in favor of further upside, especially after the Gold price confirmed a falling wedge breakout above the descending trendline resistance of $2,018 earlier in the week.
Gold buyers will need to find a strong foothold above the 50-day SMA at $2,035 to aim for the February 7 high of $2,044, followed by the $2,050 psychological barrier.
The 14-day Relative Strength Index (RSI) sits just above the midline, backing the bullish potential in Gold price.
On the contrary, if Gold buyers face rejection at the 50-day SMA, the 21-day SMA at $2,023 will be back on the sellers’ radars. A failure to defend the latter could fuel a fresh downswing toward $2,005, the confluence of the wedge resistance-turned-support and the upward-pointing 100-day SMA.
Ahead of that, Tuesday’s low of $2,015 could come to the rescue of Gold optimists.
Gold FAQs
Why do people invest in Gold?
Gold has played a key role in human’s history as it has been widely used as a store of value and medium of exchange. Currently, apart from its shine and usage for jewelry, the precious metal is widely seen as a safe-haven asset, meaning that it is considered a good investment during turbulent times. Gold is also widely seen as a hedge against inflation and against depreciating currencies as it doesn’t rely on any specific issuer or government.
Who buys the most Gold?
Central banks are the biggest Gold holders. In their aim to support their currencies in turbulent times, central banks tend to diversify their reserves and buy Gold to improve the perceived strength of the economy and the currency. High Gold reserves can be a source of trust for a country’s solvency. Central banks added 1,136 tonnes of Gold worth around $70 billion to their reserves in 2022, according to data from the World Gold Council. This is the highest yearly purchase since records began. Central banks from emerging economies such as China, India and Turkey are quickly increasing their Gold reserves.
How is Gold correlated with other assets?
Gold has an inverse correlation with the US Dollar and US Treasuries, which are both major reserve and safe-haven assets. When the Dollar depreciates, Gold tends to rise, enabling investors and central banks to diversify their assets in turbulent times. Gold is also inversely correlated with risk assets. A rally in the stock market tends to weaken Gold price, while sell-offs in riskier markets tend to favor the precious metal.
What does the price of Gold depend on?
The price can move due to a wide range of factors. Geopolitical instability or fears of a deep recession can quickly make Gold price escalate due to its safe-haven status. As a yield-less asset, Gold tends to rise with lower interest rates, while higher cost of money usually weighs down on the yellow metal. Still, most moves depend on how the US Dollar (USD) behaves as the asset is priced in dollars (XAU/USD). A strong Dollar tends to keep the price of Gold controlled, whereas a weaker Dollar is likely to push Gold prices up.
Author

Dhwani Mehta
FXStreet
Residing in Mumbai (India), Dhwani is a Senior Analyst and Manager of the Asian session at FXStreet. She has over 10 years of experience in analyzing and covering the global financial markets, with specialization in Forex and commodities markets.


