Gold Price Forecast: XAU/USD eyes a daily close above $2,700 and US Retail Sales data
- Gold price consolidates gains near $2,700, with eyes on US Retail Sales data.
- Tame US inflation data revive aggressive Fed rate cut talks, undermining the US Dollar and Treasury bond yields.
- Gold price looks north amid a bullish technical setup on the daily chart.

Gold price is trading close to the highest level in five weeks just above $2,700 in Thursday’s Asian trading. Traders look forward to a fresh batch of US economic data for the next leg higher in Gold price.
Attention turns to US Jobless Claims and Retail Sales data
This week’s tame inflation data from the US brought back expectations of interest rate cuts by the US Federal Reserve (Fed) on the table, which provided extra legs to the correction in the US Dollar (USD) and the US Treasury bond yields from multi-month highs. This accentuated the Gold price upside, with buyers briefly recapturing the $2,700 in early Asian trades this Thursday.
Traders piled up bets on a Fed rate cut in June, pricing in rising odds of a second rate reduction in 2025 after inflation data. The report indicated the recent market expectations of pricing out of rate cuts this year were excessive.
US Consumer Price Index (CPI) advanced in line with estimates at an annual rate of 2.9% in December from November's 2.7%. But core CPI, which excludes food and energy prices, rose by 3.2%, below forecasts for 3.3%. On Tuesday, the US annual PPI rose 3.3% in December, missing the expected 3.4% growth, while the core PPI inflation rose to 3.5% year-on-year (YoY) in the same period, compared to the market forecast of 3.8%.
The dovish Fed expectations, Chinese stimulus hopes and fading concerns over US President-elect Trump's disruptive trade tariffs support the prevalent risk-on market mood, keeping the safe-haven US Dollar broadly subdued and Gold price at higher levels.
Looking ahead, the focus shifts to more economic data releases from the US, including the December Retail Sales and the weekly Jobless Claims, which will provide more clarity on the Fed’s interest rate trajectory beyond January. Markets have fully priced in a rate-pause decision at the Fed’s policy meeting later this month. Gold price will also remain at the mercy of any speculations surrounding Trump’s tariff plans.
Gold price technical analysis: Daily chart
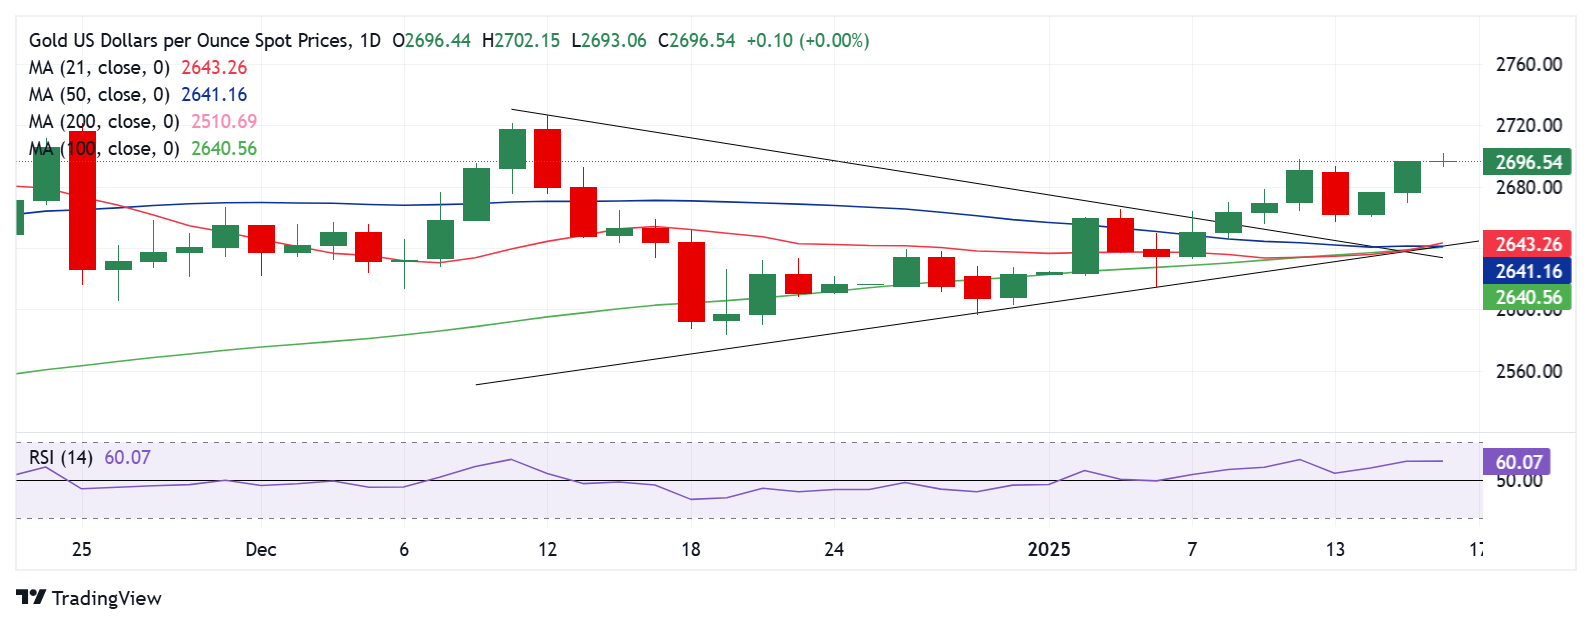
The short-term technical outlook for Gold price continues to support Gold buyers, courtesy of last week’s symmetrical triangle breakout.
The 14-day Relative Strength Index (RSI) points higher above the midline, currently near 60, suggesting that Gold price remains a ‘buy-the-dips’ trade in the coming days.
Gold price must seek a daily candlestick closing above the $2,700 barrier to initiate a fresh uptrend toward the $2,750 psychological level.
Ahead of that level, the December 12 high of $2,726 will challenge bearish commitments.
Conversely, strong support is located at the January 15 low of $2,670, below which sellers must crack the $2,640 demand area.
That zone is the confluence of the 21-day Simple Moving Average (SMA), 50-day SMA, 100-SMA and the triangle convergence, making it a powerful support.
If the downside momentum accelerates, the January 6 low of $2,615 could come to buyers’ rescue.
Gold FAQs
Gold has played a key role in human’s history as it has been widely used as a store of value and medium of exchange. Currently, apart from its shine and usage for jewelry, the precious metal is widely seen as a safe-haven asset, meaning that it is considered a good investment during turbulent times. Gold is also widely seen as a hedge against inflation and against depreciating currencies as it doesn’t rely on any specific issuer or government.
Central banks are the biggest Gold holders. In their aim to support their currencies in turbulent times, central banks tend to diversify their reserves and buy Gold to improve the perceived strength of the economy and the currency. High Gold reserves can be a source of trust for a country’s solvency. Central banks added 1,136 tonnes of Gold worth around $70 billion to their reserves in 2022, according to data from the World Gold Council. This is the highest yearly purchase since records began. Central banks from emerging economies such as China, India and Turkey are quickly increasing their Gold reserves.
Gold has an inverse correlation with the US Dollar and US Treasuries, which are both major reserve and safe-haven assets. When the Dollar depreciates, Gold tends to rise, enabling investors and central banks to diversify their assets in turbulent times. Gold is also inversely correlated with risk assets. A rally in the stock market tends to weaken Gold price, while sell-offs in riskier markets tend to favor the precious metal.
The price can move due to a wide range of factors. Geopolitical instability or fears of a deep recession can quickly make Gold price escalate due to its safe-haven status. As a yield-less asset, Gold tends to rise with lower interest rates, while higher cost of money usually weighs down on the yellow metal. Still, most moves depend on how the US Dollar (USD) behaves as the asset is priced in dollars (XAU/USD). A strong Dollar tends to keep the price of Gold controlled, whereas a weaker Dollar is likely to push Gold prices up.
Author

Dhwani Mehta
FXStreet
Residing in Mumbai (India), Dhwani is a Senior Analyst and Manager of the Asian session at FXStreet. She has over 10 years of experience in analyzing and covering the global financial markets, with specialization in Forex and commodities markets.


