Gold Price Forecast: XAU/USD eases from daily highs as bears seize control

XAU/USD Current price: $2,639.36
- United States data played against safe-haven demand.
- US Dollar's broad weakness limits XAU/USD slide in the near term.
- XAU/USD is at risk of falling despite advancing for a second consecutive day.
Spot Gold is up on Wednesday after a bundle of United States (US) macroeconomic data ended up weighing on the US Dollar(USD), albeit modestly. The USD came under modest selling pressure previous to the news, helping XAU/USD reach an intraday high of $2,658.11 during European trading hours. After the dust settled, the Greenback is showing only partial strength against the bright metal.
The country published the second estimate of the Q3 Gross Domestic Product (GDP), which was upwardly revised quarter over quarter (QoQ) to 1.9% from 1.8%. Initial Jobless Claims for the week ended November 22 improved to 213K from the previous 215K, also beating expectations of 217K.
Durable Goods Orders, in the meantime, rose a modest 0.2% in October, worse than the 0.5% advance anticipated but better than the -0.4% posted in September. Finally, the October Personal Consumption Expenditures (PCE) Price Index rose 0.2% MoM and 2.3% YoY as expected. The core annual figure increased by 2.8% YoY, also meeting the market’s forecast.
The figures had no actual impact on upcoming Federal Reserve’s (Fed) decisions, with the central bank on its way to trim interest rates by 25 bps in December. Yet, at the same time, the numbers show that the economy is doing relatively well. There is no recession in sight, unemployment is near healthy levels, and inflation is close to the Fed’s goal.
XAU/USD short-term technical outlook
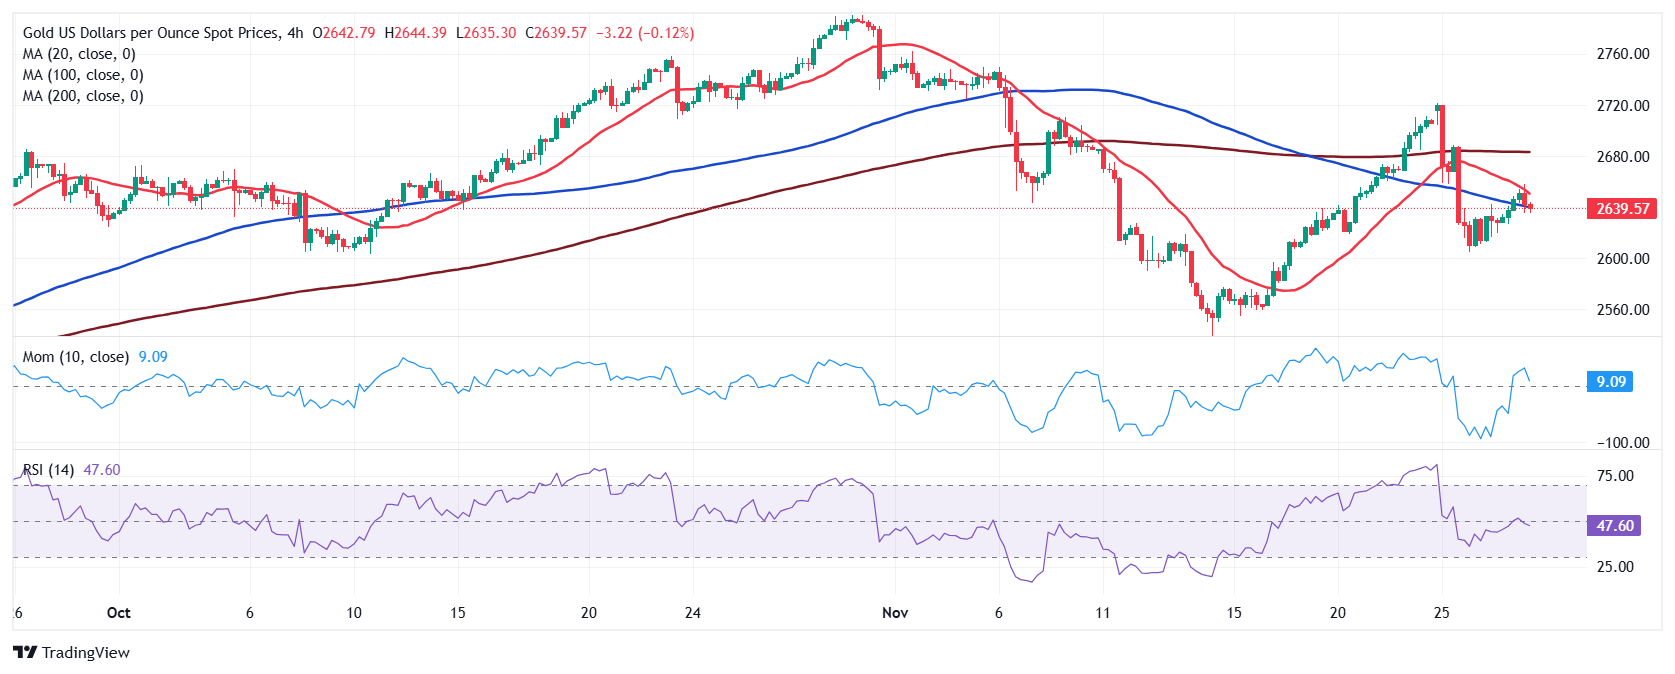
The daily for XAU/USD shows it currently hovers around $2,640, up for a second consecutive day. The risk, however, skews to the downside. Sellers rejected buyers around a bearish 20 Simple Moving Average (SMA), while technical indicators remain within negative levels, with neutral-to-bearish slopes. The 100 and 200 SMAs, in the meantime, keep heading higher below the current level, with the 100 SMA providing dynamic support at around $2,568.40.
In the near term, and according to the 4-hour chart, bears are also in control. The pair met sellers around a bearish 20 SMA and is currently below an also bearish 100 SMA. Technical indicators, in the meantime, retreated sharply after failing to overcome their midlines, in line with another leg south, particularly if XAU/USD extends its slide below the $2,626 area.
Support levels: 2,626.70 2,611.35 2,598.70
Resistance levels: 2,643.30 2,655.00 2,671.55
Premium
You have reached your limit of 3 free articles for this month.
Start your subscription and get access to all our original articles.
Author

Valeria Bednarik
FXStreet
Valeria Bednarik was born and lives in Buenos Aires, Argentina. Her passion for math and numbers pushed her into studying economics in her younger years.


