Gold Price Forecast: XAU/USD down but not out, focus shifts to US inflation data
- Gold price pulls back from six-day highs, as traders lock in gains ahead of key US inflation data.
- The US Dollar stalls decline amid pre-US CPI anxiety and looming Mid-East geopolitical risks.
- ‘Buy-the-dips’ in Gold price while 21-day SMA holds and daily RSI stays bullish on the daily chart.

Gold price is retreating from near a one-week high of $2,473 set on Monday, as traders lock in gains ahead of the key US inflation reports. The US Producer Price Index (PPI) data will hog attention later on Tuesday while the US Consumer Price Index (CPI) inflation release will stand out on Wednesday.
Iran-Israel escalation and US inflation data on tap
Markets eagerly await the high-impact inflation data from the US to gauge whether a big interest-rate hike by the US Federal Reserve (Fed) is in the offing, especially following the weak jobs report, which triggered recessionary fears and ramped up aggressive Fed rate cut bets.
Markets are now pricing in about 50% chance of a 50 bps rate cut in September by the Fed, according to the CME Group’s FedWatch Tool. Meanwhile, the headline annual CPI is set to rise 2.9% in July afte increasing by 3.0% in June. Meanwhile, the core inflation is expected to edge a tad lower to 3.2% YoY in July versus June’s 3.3% print.
That said, the US headline annual PPI is seen rising 2.3% in July after reporting a 2.6% growth in June. The core PPI inflation is set to decline from 3.0% YoY in June to 2.7% in July. The likely progress in disinflation will pave the way for a notable easing by the Fed, which could bode well for the non-interest-bearing Gold price.
Amidst increased dovish Fed expecttions, the US Treasury bond yields remain on the losing end, also hit by the rife Middle East tensions, which drive risk-off flows into the safe-haven assets such as the US government bonds and Gold price.
The traditonal safety bet, Gold price, jumped over 1% on risk aversion, courtesy of the from heightened tensions in the Middle East. White House spokesman John Kirby said late Monday that Iran could launch ‘significant’ attack on Israel this week and that the timing could affect Gaza ceasefire talks, currently scheduled to resume on August 15.
“Israel’s military and Lebanon’s Hezbollah militant group have traded strikes since the current war in Gaza began, but tensions have escalated since an Israeli strike in a Beirut suburb killed a top Hezbollah commander last month. Hezbollah has vowed to retaliate,”per CNBC News.
On Sunday, Axios reported that the Israeli intelligence community is put on a high alert, as it is believed that Iran has decided to attack Israel directly and may do so within days.
Looking ahead, geopolitical developments between Israel and Iran-backed militant groups – Hamas and Hezbollah will continue to lead sentiment and impact the value of Gold price. US inflation data and speeches from Fed policymakers will be also closely followed.
Gold price technical analysis: Daily chart
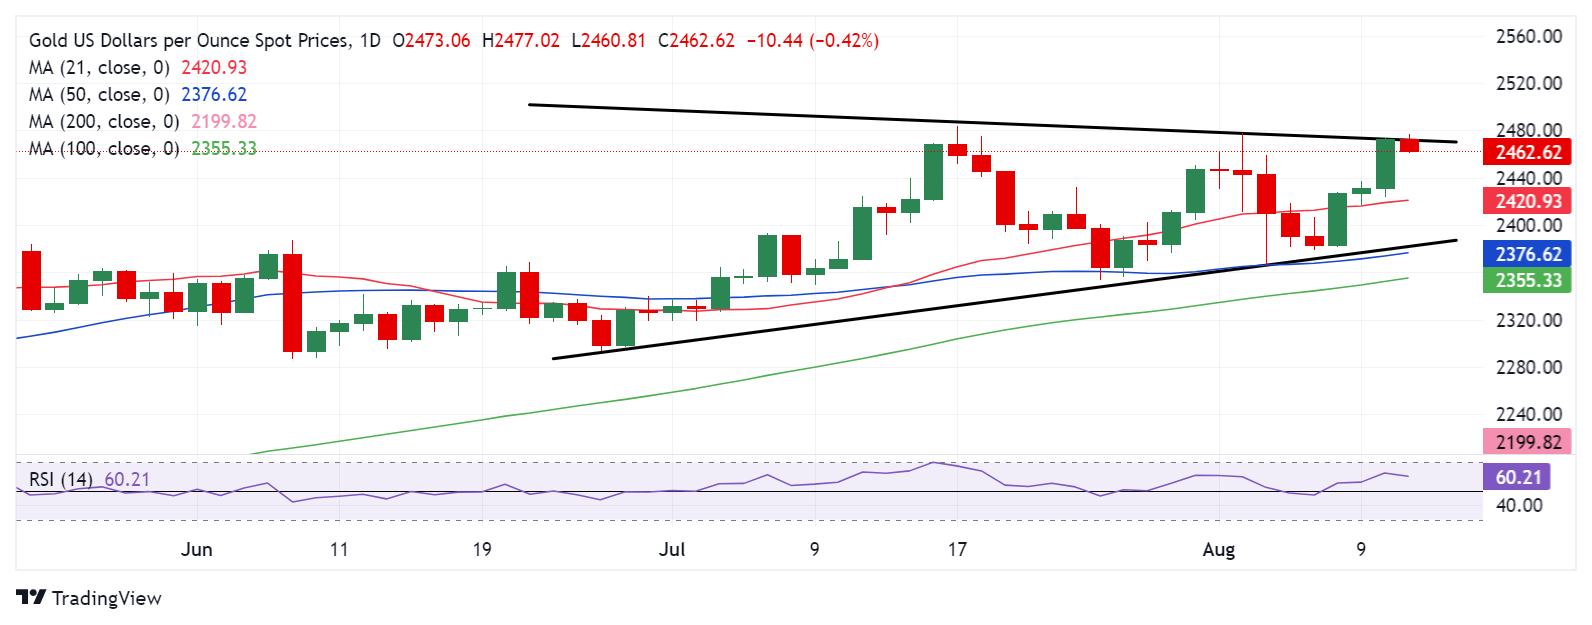
As observed on the daily chart, Gold price accelerated its recovery mode and tested the upper boundary of a symmetrical triangle formation, then pegged at $2,473.
Hwever, Gold buyers fail to secure a daily candlestick closnig above that level triggernig a fresh pullback from near a weekly high.
The key leading indicator, the 14-day Relative Strength Index (RSI) has turned south but stays above the 50 level, suggesting that any pullback in Gold price is likely to be bought into so long as the 21-day Simple Moving Average (SMA) at $2,421 holds.
However, if the pullback extends, the 21-day SMA could give way to unleash further downside, with the immediate support then seen at $2,380, where the lower boundary of the triangle and the 50-day SMA converge.
Ahead of that demand area, the $2,400 threshold could rescue buyers.
Alternatively, acceptance above the aforesaid triangle resistance, now at $2,475, is critical to taking on the record high of $2,484, above which a test of the $2,500 mark will be inevitable.
Economic Indicator
Producer Price Index (YoY)
The Producer Price Index released by the Bureau of Labor statistics, Department of Labor measures the average changes in prices in primary markets of the US by producers of commodities in all states of processing. Changes in the PPI are widely followed as an indicator of commodity inflation. Generally speaking, a high reading is seen as positive (or bullish) for the USD, whereas a low reading is seen as negative (or bearish).
Read more.Next release: Tue Aug 13, 2024 12:30
Frequency: Monthly
Consensus: 2.3%
Previous: 2.6%
Source: US Bureau of Labor Statistics
Premium
You have reached your limit of 3 free articles for this month.
Start your subscription and get access to all our original articles.
Author

Dhwani Mehta
FXStreet
Residing in Mumbai (India), Dhwani is a Senior Analyst and Manager of the Asian session at FXStreet. She has over 10 years of experience in analyzing and covering the global financial markets, with specialization in Forex and commodities markets.


