Gold Price Forecast: XAU/USD could regain $2,050 on soft US Core PCE inflation data
- Gold price rises for the second straight day on Thursday, eyes $2,050.
- US Dollar slips on risk reset and expectations of soft US Core PCE inflation data.
- The technical setup on the 4H chart remains in favor of Gold buyers.

Gold price is trading in the green zone for the second straight day early Thursday, stretching toward the two-week high of $2,041. A broad US Dollar (USD) selling amid an improvement in risk sentiment is underpinning the Gold price ahead of the all-important Personal Consumption Expenditures - Price Index (PCE) data due later in the day.
Will US inflation data aid the Gold price upside?
China’s stock markets are making a strong comeback after the previous rout, aiding the recovery in the overall market sentiment. The risk-recovery is undermining the US Dollar, allowing Gold price to extend Wednesday’s upswing.
The Greenback is also bearing the brunt of the heavy selling seen in the USD/JPY pair after the Japanese Yen rallied hard on the hawkish comments from the Bank of Japan (BoJ) board member Hajime Takata said that “momentum is rising in spring wage talks,” signaling that a policy pivot could be on the cards sooner than expected.
That said, Gold price remains on the front foot also on the back of expectations that US Core PCE Price Index, the US Federal Reserve’s (Fed) preferred inflation measure, is expected to rise 2.8% YoY in January, slowing from a 2.9% increase in December. The headline annual PCE inflation is seen falling to 2.4% in the same period from 2.6% in December.
Cooling inflation could revive early Fed rate cut bets, offering the much-needed boost to the non-interest-bearing Gold price. Markets are currently pricing in about 80% chance of a no rate cut by the Fed in the May meeting while the probability that the Fed will begin lowering rates in June stands at 62%, down from about 70% seen a week ago.
Gold price technical analysis: Four-hour chart
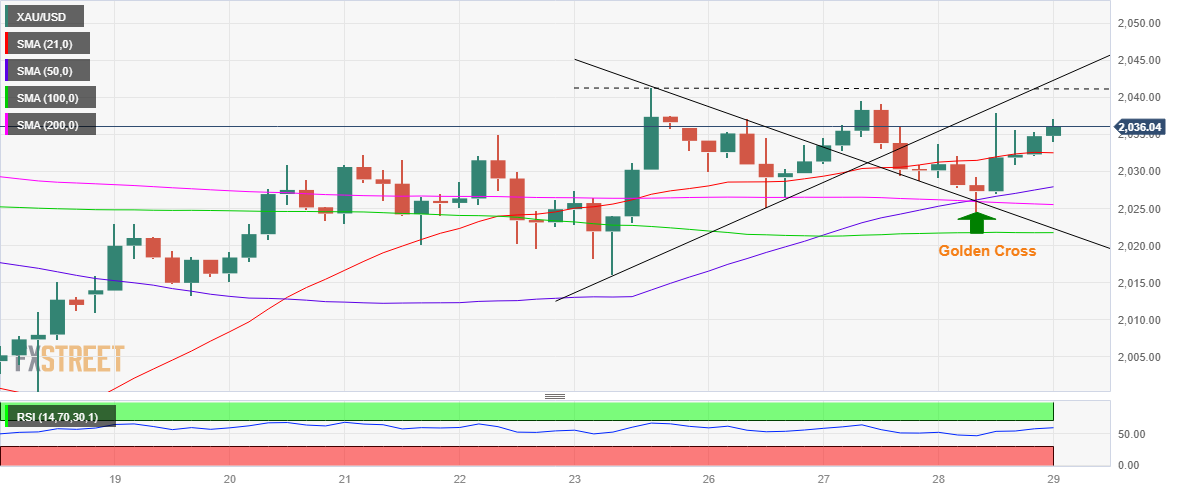
The pennant breakout and the Golden Cross confirmed on Tuesday and Wednesday respectively indicate more gains are in the offing for the Gold price.
The 50-Simple Moving Average (SMA) cross the the 200-SMA for the upside on the four-hour timeframe, validing a Golden Cross.
Th Relative Strength Index (RSI) is pointing north above the midline, adding credence to the bullish potential.
Acceptance above the two-week high of $2,041 is needed to continue to the bullish momentum toward the $2,050 psychological barrier.
The next upside target for Gold buyers is aligned the static resistance near $2,065.
On the other side, if Gold buyers fail to defend 21-SMA at $2,033, a fresh downswing toward the 50-SMA at $2,028 cannot be ruled out.
A breach of the latter could trigger a fresh drop toward the 100-SMA at $2,022. The last line of defense for Gold buyers is Friday’s low of $2,016.
Gold FAQs
Why do people invest in Gold?
Gold has played a key role in human’s history as it has been widely used as a store of value and medium of exchange. Currently, apart from its shine and usage for jewelry, the precious metal is widely seen as a safe-haven asset, meaning that it is considered a good investment during turbulent times. Gold is also widely seen as a hedge against inflation and against depreciating currencies as it doesn’t rely on any specific issuer or government.
Who buys the most Gold?
Central banks are the biggest Gold holders. In their aim to support their currencies in turbulent times, central banks tend to diversify their reserves and buy Gold to improve the perceived strength of the economy and the currency. High Gold reserves can be a source of trust for a country’s solvency. Central banks added 1,136 tonnes of Gold worth around $70 billion to their reserves in 2022, according to data from the World Gold Council. This is the highest yearly purchase since records began. Central banks from emerging economies such as China, India and Turkey are quickly increasing their Gold reserves.
How is Gold correlated with other assets?
Gold has an inverse correlation with the US Dollar and US Treasuries, which are both major reserve and safe-haven assets. When the Dollar depreciates, Gold tends to rise, enabling investors and central banks to diversify their assets in turbulent times. Gold is also inversely correlated with risk assets. A rally in the stock market tends to weaken Gold price, while sell-offs in riskier markets tend to favor the precious metal.
What does the price of Gold depend on?
The price can move due to a wide range of factors. Geopolitical instability or fears of a deep recession can quickly make Gold price escalate due to its safe-haven status. As a yield-less asset, Gold tends to rise with lower interest rates, while higher cost of money usually weighs down on the yellow metal. Still, most moves depend on how the US Dollar (USD) behaves as the asset is priced in dollars (XAU/USD). A strong Dollar tends to keep the price of Gold controlled, whereas a weaker Dollar is likely to push Gold prices up.
Author

Dhwani Mehta
FXStreet
Residing in Mumbai (India), Dhwani is a Senior Analyst and Manager of the Asian session at FXStreet. She has over 10 years of experience in analyzing and covering the global financial markets, with specialization in Forex and commodities markets.