Gold Price Forecast: XAU/USD buyers turn cautious ahead of US CPI inflation test
- Gold price meets sellers again above $2,675 heading into the US CPI release.
- Softer US PPI data add to the US Dollar and Treasury bond yields correction.
- Gold price stays hopeful amid the daily chart's triangle breakout and bullish RSI.

Gold price returns to the red early Wednesday as buyers switch to the sidelines, awaiting the US Consumer Price Index (CPI) data release for further insights on the Federal Reserve’s (Fed) interest rate path.
Gold price eyes US CPI inflation data for cues on Fed’s policy
Gold price reverses a part of the previous day’s rebound as sellers continue to lurk above $2,675. The US Dollar (USD) and the US Treasury bond yields remain subdued so far this Wednesday, unable to lend support to the bright metal. Traders refrain from placing fresh bets on Gold price while cashing on the recent long positions heading into the US CPI test, especially after softer-than-expected Producer Price Index (PPI) readings.
Data published on Tuesday showed that the US annual PPI rose 3.3% in December, missing the expected 3.4% growth, while the core PPI inflation rose to 3.5% year-on-year (YoY) in the same period, compared to the market forecast of 3.8%. Monthly figures also disappointed. Despite the softer data, markets have fully priced in a rate cut pause at the Fed's policy meeting later this month.
Therefore, the stakes are high for the US CPI report as it could alter the market’s pricing of the Fed rate cut outlook this year. Traders have scaled back their bets to only one Fed rate cut in 2025 from two predicted in December last year, according to the CME Group’s FedWatch Tool, following the strong December US Nonfarm Payrolls (NFP) data.
The hawkish Fed bets are backed by the premise that US President-elect Donald Trump, set to begin his second term next week, will likely fuel inflation with his protectionist policies.
Economists expect the headline US CPI to rise 2.9% YoY in December after increasing 2.7% in November. The annual core CPI inflation is seen steady at 3.3% in the reported period. The monthly CPI inflation will likely remain at 0.3%, while the core figure is set to ease slightly to 0.2% in December.
A hotter-than-expected US CPI report could affirm expectations of just one Fed rate cut this year or prompt markets to price out any easing. This could trigger a fresh sell-off in the non-interest-bearing Gold price. Meanwhile, disappointing CPI figures could provide extra legs to the ongoing bullish momentum.
Gold price technical analysis: Daily chart
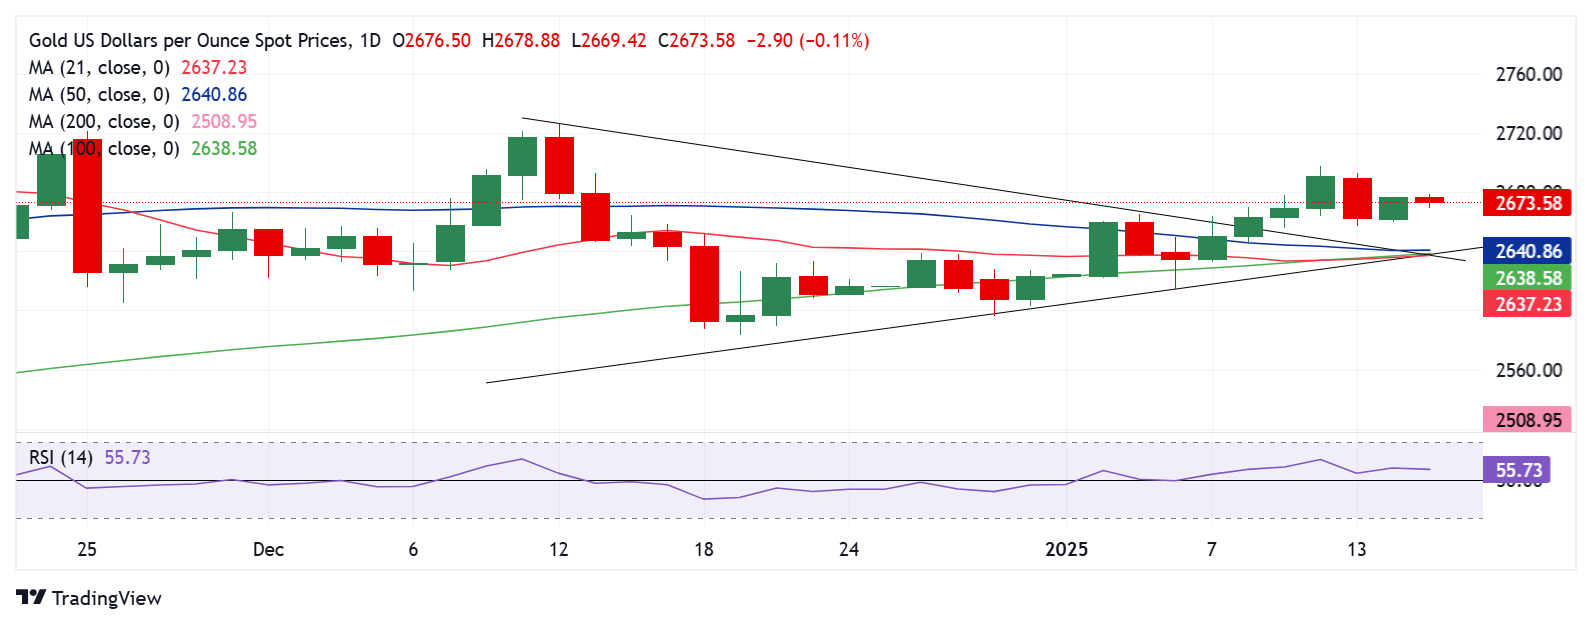
Nothing changes for Gold price from a short-term technical perspective, as buyers have entered a bullish consolidation phase following last week’s symmetrical triangle breakout.
The 14-day Relative Strength Index (RSI) continues to hold well above the midline, currently near 56, suggesting that Gold price remains a ‘buy-the-dips’ trade in the coming days.
Gold price needs to find a sustained break above the $2,675 barrier on the way to the $2,700 barrier to regain upside traction.
Daily candlestick closing above that level is critical to extending the uptrend toward the December 12 high of $2,726.
Alternatively, strong support is located at the January 13 low of $2,656, below which sellers must crack the $2,640 demand area.
That zone is the confluence of the 21-day Simple Moving Average (SMA), 50-day SMA, 100-SMA and the triangle convergence, making it a powerful support.
If the downside momentum accelerates, the January 6 low of $2,615 could come to buyers’ rescue.
Economic Indicator
Consumer Price Index (YoY)
Inflationary or deflationary tendencies are measured by periodically summing the prices of a basket of representative goods and services and presenting the data as The Consumer Price Index (CPI). CPI data is compiled on a monthly basis and released by the US Department of Labor Statistics. The YoY reading compares the prices of goods in the reference month to the same month a year earlier.The CPI is a key indicator to measure inflation and changes in purchasing trends. Generally speaking, a high reading is seen as bullish for the US Dollar (USD), while a low reading is seen as bearish.
Read more.Next release: Wed Jan 15, 2025 13:30
Frequency: Monthly
Consensus: 2.9%
Previous: 2.7%
Source: US Bureau of Labor Statistics
The US Federal Reserve has a dual mandate of maintaining price stability and maximum employment. According to such mandate, inflation should be at around 2% YoY and has become the weakest pillar of the central bank’s directive ever since the world suffered a pandemic, which extends to these days. Price pressures keep rising amid supply-chain issues and bottlenecks, with the Consumer Price Index (CPI) hanging at multi-decade highs. The Fed has already taken measures to tame inflation and is expected to maintain an aggressive stance in the foreseeable future.
Author

Dhwani Mehta
FXStreet
Residing in Mumbai (India), Dhwani is a Senior Analyst and Manager of the Asian session at FXStreet. She has over 10 years of experience in analyzing and covering the global financial markets, with specialization in Forex and commodities markets.