Gold Price Forecast: XAU/USD buyers try their luck again heading into US inflation showdown
- Gold price preserves recent gains above $2,500 on US CPI inflation day.
- The US Dollar tracks USD/JPY sell-off amid weak US Treasury bond yields and risk-off flows.
- Gold buyers look to retest record highs at $2,532 after defending 21-day SMA. The daily RSI stays bullish.

Gold price is consolidating a two-day uptrend above $2,500 in Wednesday’s Asian trading. Gold buyers take a breather, with the next directional move likely triggered by the critical US Consumer Price Index (CPI) data due later this Wednesday.
Gold price risks a big reaction to US CPI data
Gold traders have tuned on the sidelines, refraining from placing fresh bets before the US inflation test, which could confirm the size of the US Federal Reserve (Fed) interest rate cut next week. The data is critical to determining the next direction in Gold price, as it hangs close to the record high of $2,532 set on August 20.
US CPI is seen rising 2.6% YoY in August after recording a 2.9% increase in July. The core CPI inflation is expected to hold steady at 3.2% YoY in the same period. Meanwhile, the monthly headline and core CPIs are set to rise 0.2%, at the same pace as seen previously.
An upside surprise to the annual and monthly inflation readings could trigger a fresh US Dollar recovery at the expense of the Gold price, washing out expectations of an outsized Fed rate cut. Conversely, a softer-than-expected headline and core annual CPI data could revive 50 basis points (bps) Fed rate reduction bets, slamming the US Dollar (USD) while propelling Gold price to fresh lifetime highs.
Markets are currently pricing in a 33% chance of a 50 bps rate cut move while the odds of a 25 bps rate cut stand at 67%, the CME Group’s FedWatch Tool shows.
In the lead-up to the US CPI showdown, Gold price stays supported by renewed selling in the US Dollar, courtesy of the steep USD/JPY sell-off. The Japanese Yen spiked to fresh eight-month highs against the USD near 141.50 after the hawkish remarks from Bank of Japan (BoJ) board member Junko Nagakawa. The policymaker signaled the bank’s readiness to hike rates further, highlighting the policy divergence between the Fed and the BoJ.
Meanwhile, the first US Presidential debate between former President Donald Trump and Democratic nominee Kamala Harris in Pennsylvania failed to have any significant impact on the financial markets, as investors traded with caution and scurried to the safety of the US government bonds. This weighed negatively on the US Treasury bond yields, allowing Gold price to stay on the front foot.
Gold price technical analysis: Daily chart
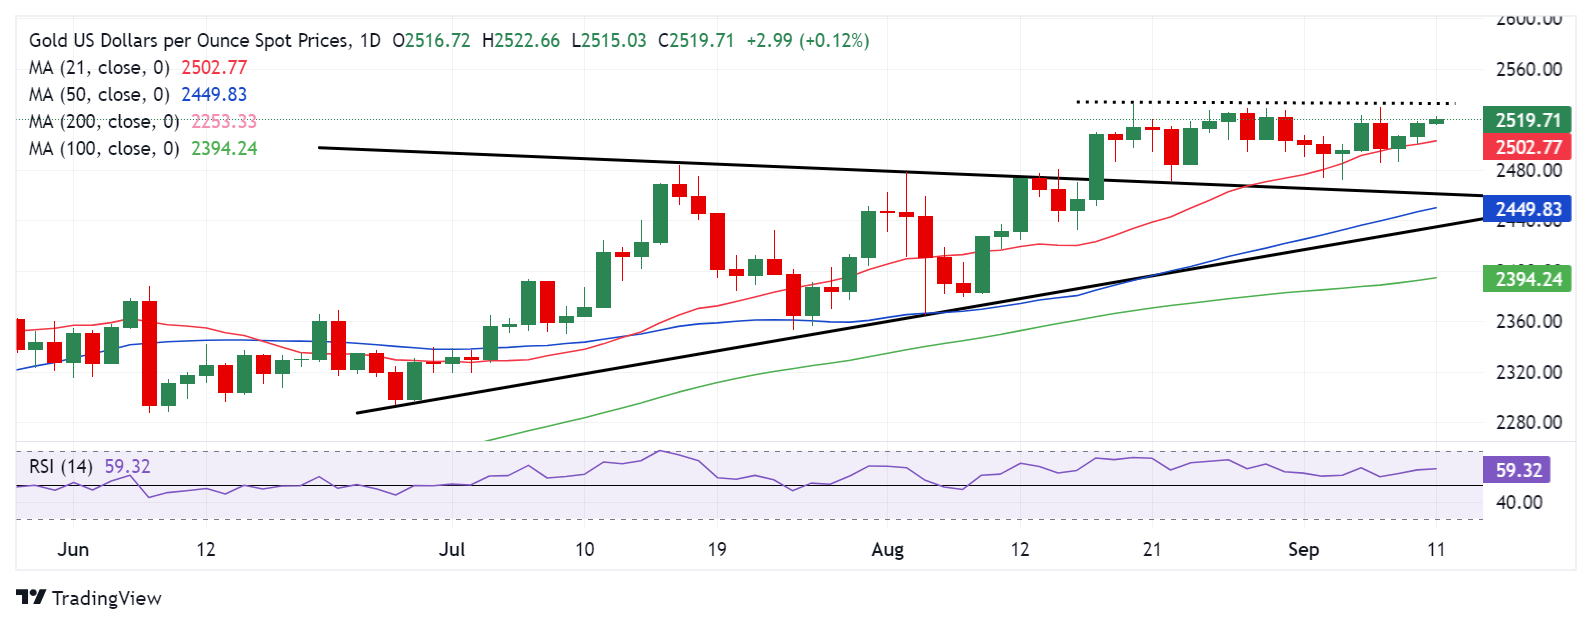
Nothing seems to have changed for Gold price from a short-term technical perspective. Buyers continue to stay hopeful as Gold price managed to close above the 21-day Simple Moving Average (SMA), now at $2,503, for the second day in a row on Tuesday.
The 14-day Relative Strength Index (RSI) points higher once again while well above the 50 level, justifying the bullish potential.
Gold buyers now aim for a sustained breakthrough the record high of $2,532, above which the $2,550 psychological level will come into play.
If Gold price faces rejection once again near the $2,530 supply zone, a correction would ensue, with a daily closing below the 21-day SMA at $2,503 needed to negate the bullish outlook in the near term.
A breach of the latter will challenge the previous week’s low of $2,472, followed by the symmetrical triangle resistance-turned-support at $2,462.
Economic Indicator
Consumer Price Index (YoY)
Inflationary or deflationary tendencies are measured by periodically summing the prices of a basket of representative goods and services and presenting the data as The Consumer Price Index (CPI). CPI data is compiled on a monthly basis and released by the US Department of Labor Statistics. The YoY reading compares the prices of goods in the reference month to the same month a year earlier.The CPI is a key indicator to measure inflation and changes in purchasing trends. Generally speaking, a high reading is seen as bullish for the US Dollar (USD), while a low reading is seen as bearish.
Read more.Next release: Wed Sep 11, 2024 12:30
Frequency: Monthly
Consensus: 2.6%
Previous: 2.9%
Source: US Bureau of Labor Statistics
The US Federal Reserve has a dual mandate of maintaining price stability and maximum employment. According to such mandate, inflation should be at around 2% YoY and has become the weakest pillar of the central bank’s directive ever since the world suffered a pandemic, which extends to these days. Price pressures keep rising amid supply-chain issues and bottlenecks, with the Consumer Price Index (CPI) hanging at multi-decade highs. The Fed has already taken measures to tame inflation and is expected to maintain an aggressive stance in the foreseeable future.
Author

Dhwani Mehta
FXStreet
Residing in Mumbai (India), Dhwani is a Senior Analyst and Manager of the Asian session at FXStreet. She has over 10 years of experience in analyzing and covering the global financial markets, with specialization in Forex and commodities markets.