Gold Price Forecast: XAU/USD buyers take a breather ahead of US PPI inflation data
- Gold price turns lower after hitting five-week highs near $2,725 early Thursday.
- Rising US Treasury bond yields offset Fed rate cut optimism ahead of US PPI, jobs data.
- Gold price pulls back before the next push higher as the daily RSI stays bullish.

Gold's price seems to have paused its four-day recovery stint in Asian trading on Thursday after hitting fresh five-week highs near $2,725. Traders assess the odds of US Federal Reserve (Fed) interest rate cuts next year amid the ongoing upsurge in the US Treasury bond yields across curve.
Gold price looks to US data for further impetus
Gold price has benefited this week from expectations of Chinese stimulus, Fed rate cut optimism, Middle East geopolitical tensions and the advance in the US Treasury bond yields. Despite an imminent Fed rate cut next week, US Treasury bond yields remain firm on ample supply of long-data US bonds and a widening budget deficit.
The latest data showed that the US government posted a $367 billion budget deficit for November, up 17% from a year earlier. Meanwhile, the Treasury Department saw good demand for a $39 billion sale of 10-year notes, the second sale of $119 billion in coupon-bearing sales after a solid $58 auction of three-year notes on Tuesday.
These supporting factors helped the US Treasury bond yields make a strong comeback after the US Consumer Price Index (CPI) data-led downtick. The US Dollar also tracked yields higher even as the US inflation data aligned with market expectations. Data showed that the US annual CPI and core rose 2.7% and 3.3%, respectively, while on a monthly basis, both figures came in at 0.3%.
Markets are now predicting a 91% chance of the Fed lowering rates by 25 basis points (bps) next week while the odds for a January rate cut edge down to about 19%, the CME Group’s FedWatch Tool shows.
Despite this Gold price remained underpinned and clinched two-week highs at $2,721 on Wednesday. Uncertainty over the Syrian political environment, China’s stimulus optimism and the People’s Bank of China’s (PBOC) addition to its Gold reserves rendered positive for the non-yielding Gold price.
However, buyers seem to have turned cautious early Thursday, despite the US Dollar pullback as US Treasury bond yields continue to trend higher, anticipating the sale of $22 billion in 30-year bonds later in the day.
The focus also remains on the US Producer Price Index (PPI) and the weekly Jobless Claims data for fresh hints on the path of the Fed’s easy policy and the direction of the USD heading into the Fed meeting next week. The sentiment surrounding the Fed and risk trends will continue to play a crucial role in the Gold price action.
Gold price technical analysis: Daily chart
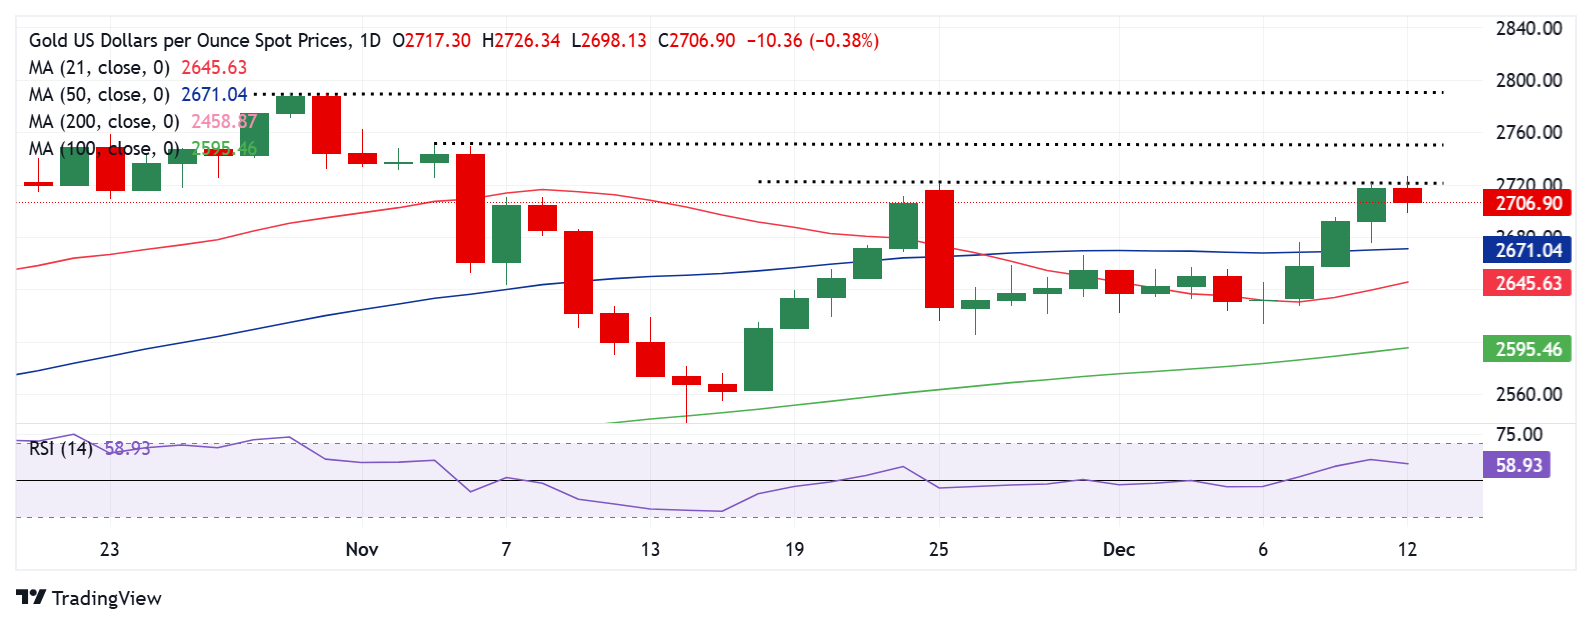
The daily chart shows that the Gold price has turned south in tandem with the 14-day Relative Strength Index (RSI) so far this Thursday.
The leading indicator eases toward 50.00 while holding well above it.
If the pullback from the multi-week high extends, Gold price could find initial demand at the 50-day Simple Moving Average (SMA) at $2,671.
The next relevant downside targets align at the 21-day SMA at $2,646, below which the previous week’s low of $2,613 will be tested.
However, if buyers regain poise, Gold price could retest the multi-week high of $2,726, above which 2,750, the confluence of the psychological barrier and the November 5 high, will act as a tough nut to crack.
Fresh buying opportunities will likely emerge on a sustained move above the latter, calling for a test of the record high of $2,790.
Gold FAQs
Gold has played a key role in human’s history as it has been widely used as a store of value and medium of exchange. Currently, apart from its shine and usage for jewelry, the precious metal is widely seen as a safe-haven asset, meaning that it is considered a good investment during turbulent times. Gold is also widely seen as a hedge against inflation and against depreciating currencies as it doesn’t rely on any specific issuer or government.
Central banks are the biggest Gold holders. In their aim to support their currencies in turbulent times, central banks tend to diversify their reserves and buy Gold to improve the perceived strength of the economy and the currency. High Gold reserves can be a source of trust for a country’s solvency. Central banks added 1,136 tonnes of Gold worth around $70 billion to their reserves in 2022, according to data from the World Gold Council. This is the highest yearly purchase since records began. Central banks from emerging economies such as China, India and Turkey are quickly increasing their Gold reserves.
Gold has an inverse correlation with the US Dollar and US Treasuries, which are both major reserve and safe-haven assets. When the Dollar depreciates, Gold tends to rise, enabling investors and central banks to diversify their assets in turbulent times. Gold is also inversely correlated with risk assets. A rally in the stock market tends to weaken Gold price, while sell-offs in riskier markets tend to favor the precious metal.
The price can move due to a wide range of factors. Geopolitical instability or fears of a deep recession can quickly make Gold price escalate due to its safe-haven status. As a yield-less asset, Gold tends to rise with lower interest rates, while higher cost of money usually weighs down on the yellow metal. Still, most moves depend on how the US Dollar (USD) behaves as the asset is priced in dollars (XAU/USD). A strong Dollar tends to keep the price of Gold controlled, whereas a weaker Dollar is likely to push Gold prices up.
Author

Dhwani Mehta
FXStreet
Residing in Mumbai (India), Dhwani is a Senior Analyst and Manager of the Asian session at FXStreet. She has over 10 years of experience in analyzing and covering the global financial markets, with specialization in Forex and commodities markets.


