Gold Price Forecast: XAU/USD buyers refuse to give up as focus shifts to US inflation data
- Gold price rebounds above $2,660 early Tuesday, with eyes on key US inflation data.
- Speculations surrounding Trump’s tariff plans drive US Dollar and Gold price action.
- Technically, Gold price appears as a ‘buy-the-dip’ trade on the daily time frame.
Gold price is back on the bids in Asian trading on Tuesday, having found fresh buyers near the $2,660 region. Gold buyers try their luck again heading into the US inflation test, with the Producer Price Index (PPI) slated for release later in the day.
Gold price regains traction amid Trump’s tariffs chatter
The US Dollar (USD) consolidates its overnight retreat while the US Treasury bond yields lick their wounds early Tuesday, allowing Gold price to make another run toward the $2,700 barrier.
The risk-on rally in Chinese equities lifts the broader market sentiment, keeping the safe-haven USD on edge. Investors remain expectant of more stimulus from China, especially after recent Chinese efforts to support the Yuan and economic growth.
Goldman Sachs Chief Economist Jan Hatzius said: “China plans to implement a variety of stimulus measures to counter the impact of anticipated US tariffs and a continued housing market downturn.”
Markets also cash in on their USD longs ahead of the top-tier US PPI data, which will likely be closely scrutinized in the lead-up to Wednesday's Consumer Price Index (CPI) showdown.
Traders have scaled back their bets for a US Federal Reserve (Fed) interest rate cut this year to only one from two predicted in December last year, according to the CME Group’s FedWatch Tool, following a strong US Nonfarm Payrolls report released on Friday.
Therefore, the US inflation data are critical to affirming the hawkish Fed expectations, significantly impacting the Greenback alongside the Gold price. The annual US PPI inflation is expected to increase to 3.4% in December from 3% in November, while core PPI is seen rising 3.7% in the same period after reporting a 3.4% growth previously.
Hot inflation data could revive the US Dollar’s demand and resume the Gold price correction. However, the Gold price could recapture $2,700 and beyond on a downside surprise to the PPI print, prompting markets to prepare for a softer CPI report on Wednesday. It’s worth nothing that any chatter about Trump’s tariff plans could also play a pivotal role in the Gold price action.
Gold price corrected from a monthly high on Monday despite increased inflationary concerns in the incoming US President Donald Trump’s 2.0 era. Gold price is considered as a hedge against inflation.
Additionally, the bright metal failed to benefit from a sharp pullback in the US Dollar and the US Treasury bond yields after a Bloomberg report. Citing people familiar with the matter, Bloomberg reported late Monday that advisors on Trump’s incoming economic team are considering gradually implementing tariffs, increasing them incrementally each month by 2% to 5% per month.
Gold price technical analysis: Daily chart
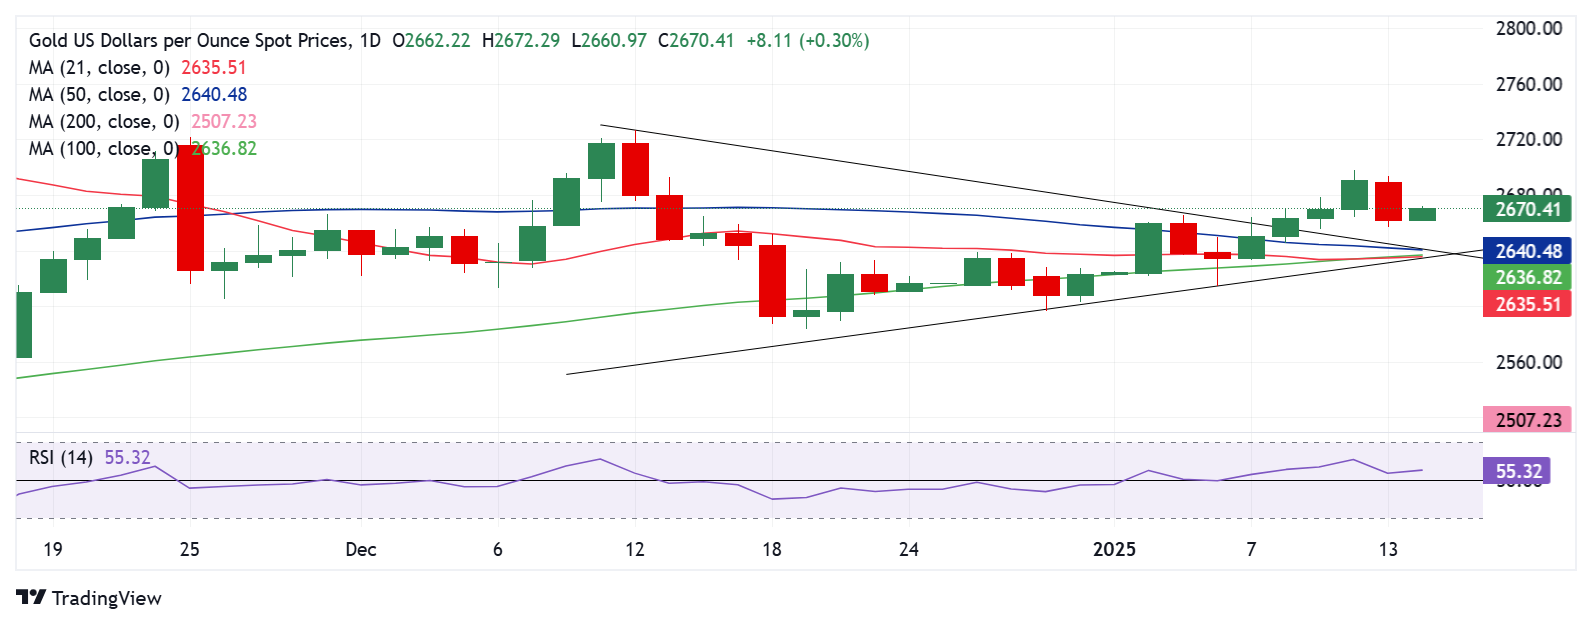
The short-term technical outlook for Gold price remains more or less the same, with more upside likely in the offing following the previous week’s symmetrical triangle breakout.
The 14-day Relative Strength Index (RSI) points north above the midline, currently near 55, adding credence to the bullish potential in Gold price.
Gold price looks to take out the $2,700 barrier should buyers extend control.
The next upside barriers are aligned at the $2,710 round level and the December 12 high of $2,726.
On the other side, strong support is around $2,641, where the 50-day SMA coincides with the triangle resistance.
On sustained declines, Gold price could find immediate respite at $2,635, the confluence of the 21-day SMA and the 100-day SMA.
The last line of defense for Gold buyers is seen at the January 6 low of $2,615.
Economic Indicator
Producer Price Index (YoY)
The Producer Price Index released by the Bureau of Labor statistics, Department of Labor measures the average changes in prices in primary markets of the US by producers of commodities in all states of processing. Changes in the PPI are widely followed as an indicator of commodity inflation. Generally speaking, a high reading is seen as positive (or bullish) for the USD, whereas a low reading is seen as negative (or bearish).
Read more.Next release: Tue Jan 14, 2025 13:30
Frequency: Monthly
Consensus: 3.4%
Previous: 3%
Source: US Bureau of Labor Statistics
Author

Dhwani Mehta
FXStreet
Residing in Mumbai (India), Dhwani is a Senior Analyst and Manager of the Asian session at FXStreet. She has over 10 years of experience in analyzing and covering the global financial markets, with specialization in Forex and commodities markets.


