Gold Price Forecast: XAU/USD awaits US employment data for the range breakout
- Gold price rebound fizzles near $2,355 early Tuesday, despite a mixed tone.
- The US Dollar recovers with US Treasury bond yields after a weak US ISM PMI-led sell-off.
- The daily RSI battles the 50 level, as Gold price readies for a range breakout.

Gold price is facing a modest selling pressure near $2,355 in Asian trading on Tuesday, pausing its solid rebound staged a day ago. Gold price eagerly awaits the US employment data trickling in this week, starting with the JOLTS Job Openings later on Tuesday, for a fresh directional impetus.
Gold price looks to US jobs data for Fed policy cues
On Monday, Gold price defended the critical daily support line and witnessed a solid turnaround in the latter part of the day after the US Dollar was smashed alongside the US Treasury bond yields, following the release of downbeat Institute for Supply Management (ISM) Manufacturing PMI and the Price Paid component.
Data released by the ISM showed on Monday, the main PMI index dropped from 49.2 in April to 48.7 in May, missing the expected 49.6 print. The ISM Manufacturing Prices Paid eased to 57.0 in May vs. 60.9 previous and 60.0 expected.
Weak data revived bets for a September interest rate cut by the US Federal Reserve (Fed). Markets are currently pricing in about a 52% chance of a 25 basis points (bps) Fed rate cut in September, against a 47% probability of such a reduction last Friday, CME Group’s FedWatch tool shows.
In Tuesday's trading so far, Gold price is struggling to hold its recovery momentum, as the US Dollar attempts a tepid bounce along with the US Treasury bond yields, as the market mood turns cautious ahead of the key US employment data. The US JOLTS Job Opening is likely to show a slight decrease to 8.34 million on the last day of April, as against the previous reading of 8.488 million.
Additionally, the broader market sentiment will also play a pivotal role in the Gold price action, as markets seek Fed policy cues from the upcoming employment data due for release this week. The ADP employment report will be published on Wednesday and Nonfarm Payrolls data will feature on Friday. The data will help gauge the US economic performance, which will have a significant impact on the Fed’s policy action, the value of the US Dollar and the non-interest-bearing Gold price.
Gold price technical analysis: Daily chart
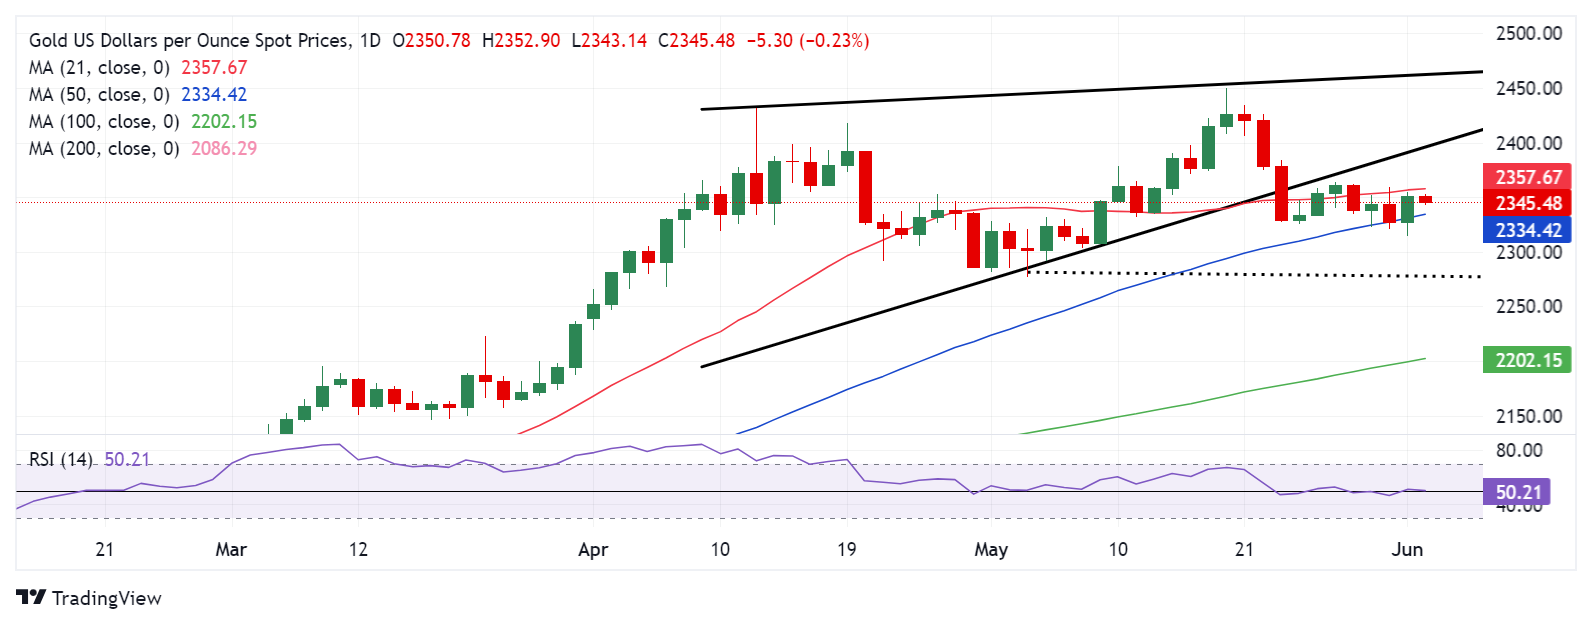
As observed on the daily chart, the Gold price continues to range between the 21-day Simple Moving Average (SMA) and 50-day SMA at $2,357 and $2,334 respectively.
The 14-day Relative Strength Index (RSI) has managed to crawl back above the midline but it seems to be struggling to defend it, at the moment.
If Gold sellers manage to crack the 50-day SMA at $2,334 on a daily closing basis, a test of the $2,300 level will be inevitable.
Further south, a drop toward the May 3 low of $2,277 will be in the offing.
Alternatively, acceptance above the 21-day SMA at $2,357 could put the May 24 high of $2,364 on buyers’ radars.
A sustained move above that level will fuel a run toward the rising wedge support-turned-resistance, then at $2,396.
(This story was corrected on Tuesday at 6:42 GMT to say that 'In Tuesday's trading so far', not Monday's)
Gold FAQs
Gold has played a key role in human’s history as it has been widely used as a store of value and medium of exchange. Currently, apart from its shine and usage for jewelry, the precious metal is widely seen as a safe-haven asset, meaning that it is considered a good investment during turbulent times. Gold is also widely seen as a hedge against inflation and against depreciating currencies as it doesn’t rely on any specific issuer or government.
Central banks are the biggest Gold holders. In their aim to support their currencies in turbulent times, central banks tend to diversify their reserves and buy Gold to improve the perceived strength of the economy and the currency. High Gold reserves can be a source of trust for a country’s solvency. Central banks added 1,136 tonnes of Gold worth around $70 billion to their reserves in 2022, according to data from the World Gold Council. This is the highest yearly purchase since records began. Central banks from emerging economies such as China, India and Turkey are quickly increasing their Gold reserves.
Gold has an inverse correlation with the US Dollar and US Treasuries, which are both major reserve and safe-haven assets. When the Dollar depreciates, Gold tends to rise, enabling investors and central banks to diversify their assets in turbulent times. Gold is also inversely correlated with risk assets. A rally in the stock market tends to weaken Gold price, while sell-offs in riskier markets tend to favor the precious metal.
The price can move due to a wide range of factors. Geopolitical instability or fears of a deep recession can quickly make Gold price escalate due to its safe-haven status. As a yield-less asset, Gold tends to rise with lower interest rates, while higher cost of money usually weighs down on the yellow metal. Still, most moves depend on how the US Dollar (USD) behaves as the asset is priced in dollars (XAU/USD). A strong Dollar tends to keep the price of Gold controlled, whereas a weaker Dollar is likely to push Gold prices up.
Author

Dhwani Mehta
FXStreet
Residing in Mumbai (India), Dhwani is a Senior Analyst and Manager of the Asian session at FXStreet. She has over 10 years of experience in analyzing and covering the global financial markets, with specialization in Forex and commodities markets.