Gold Price Forecast: Room to rise towards $1825? XAU/USD awaits US inflation, Fed’s Powell
- Gold price has ditched the bears, rising on anxiety pre-Fed’s Powell.
- Gold also benefits from escalating geopolitical tensions and covid woes.
- Gold’s 4H chart shows a falling wedge breakout ahead of key event risks.

Gold price witnessed another choppy session on Thursday, although maintained its weekly range between $1810 and $1777, as the three-day Jackson Hole Symposium kickstarted. In the first half of the day, gold price witnessed a sharp drop to $1780 levels, as the US dollar rebounded firmly amid two fresh bullish catalysts. Re-emergence of hawkish Fed expectations, after Dallas Fed President Robert Kaplan said that he would like to see a tapering of bond purchases announced in September, rescued to the dollar bulls. Meanwhile, the reports of the Kabul explosion by ISIS further bolstered the haven demand for the greenback.
However, the dour mood on the global stocks amid Fed’s anxiety and geopolitical tensions over Afghanistan helped a swift recovery in gold price. Meanwhile, the Treasury yields retraced from weekly highs amid a flight to safety in the US bonds, aiding gold’s rebound. Amidst the hawkish Fed view and Kabul blasts, markets paid little heed to the US Q2 Preliminary GDP and other minority reports.
Gold price is extending the rebound while battling $1800 ahead of Fed Chair Jerome Powell’s showdown on the second day of the annual event. Investors will look forward to any hints on the taper timing from Powell, although the Delta covid variant concerns have recently watered down the hawkish bets. Gold traders will await the US PCE inflation data ahead of Powell’s address. But Powell’s take on the monetary policy will set the tone for the market in the coming days, heavily impacting the USD valuations and gold price.
In the meantime, markets will watch out for fresh updates on the US-Afghanistan tensions, with President Joe Biden pledging to strike back on ISIS. Also, the Fed’s speculation will continue to influence gold trades in the session ahead.
Gold Price Chart - Technical outlook
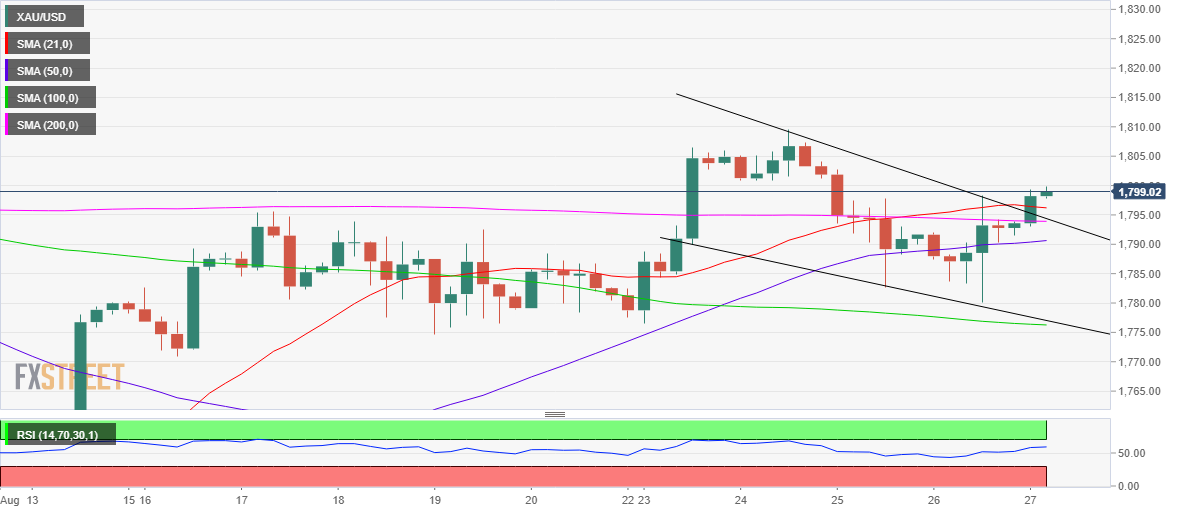
Gold: Four-hour chart
Gold price has confirmed a falling wedge breakout after closing above the falling trendline resistance at $1795 on a four-hour candlestick basis.
The upside breakout has re-opened doors towards $1825, which is the pattern target, However, the weekly highs at $1810 could challenge the bullish attempts on a sustained move above $1800.
The Relative Strength Index (RSI) is edging higher towards the overbought territory, well above the midline, allowing room for more gains.
On the flip side, 21-Simple Moving Average (SMA) at $1796 is likely to offer an immediate cushion to the bulls.
The confluence of the 200-SMA and wedge resistance-turned-support at $1794 will be the next relevant target for gold sellers.
Further south, the horizontal 50-SMA at $1791 will be back in play, with a follow-through downside bias likely to fuel a fresh sell-off towards the pattern support and 100-SMA convergence around $1777.
Author

Dhwani Mehta
FXStreet
Residing in Mumbai (India), Dhwani is a Senior Analyst and Manager of the Asian session at FXStreet. She has over 10 years of experience in analyzing and covering the global financial markets, with specialization in Forex and commodities markets.


