|

Gold Price Forecast: Risks skewed to the upside after bounce from key support

  • Gold's strong bounce from key average has invalidated the bearish case. 
  • Gulf tensions will likely keep the metal better bid next week. 
  • Hawkish Fed rate cut and easing US-China trade tensions may cap upside around $1,525.

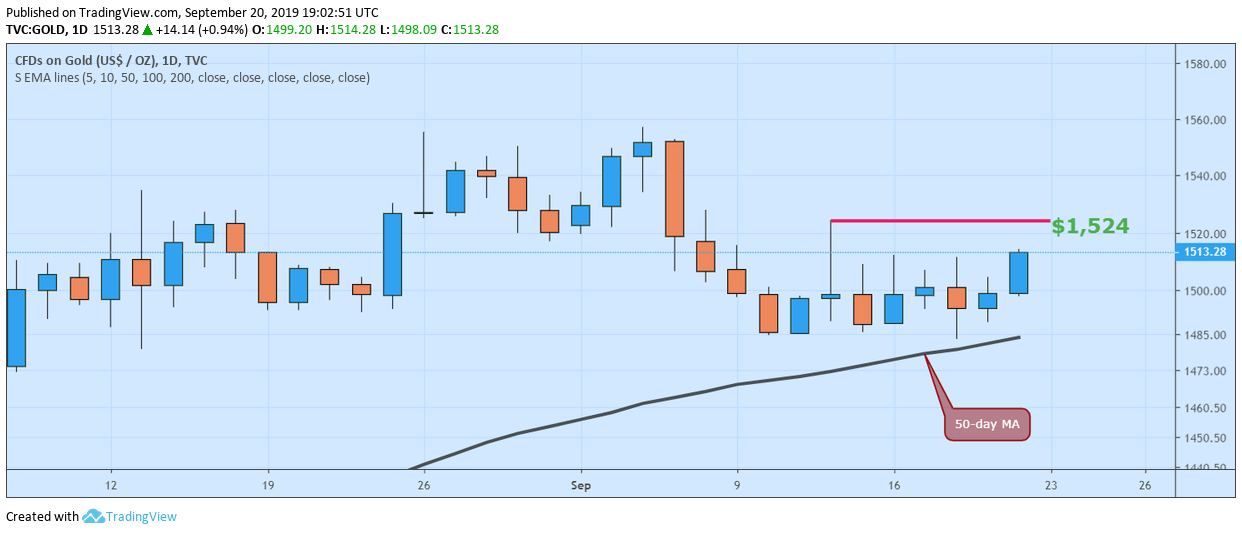
Gold is about to end the week on a positive note, having bounced strongly from key support and could challenge resistance at $1,524 next week. 

The yellow metal is currently trading at $1,510 per Oz, representing 1.48% gains on Monday’s opening of price $1,488. Prices fell 0.42, 0.90 and 1.2% in the previous three weeks. 

The safe-haven metal was looking weak last Friday with charts favoring a deeper drop to levels below $1,480. 

Gold, however, picked up a bid on Monday and printed highs above $1,500, as an attack on Saudi’s oil facilities triggered a wave of risk aversion, sending safe havens higher. The metal remained flat-lined around $1,500 on Tuesday before falling to $1,483 on Wednesday after the Federal Reserve (Fed) delivered a hawkish rate cut. 

The post-Fed drop, however, was short-lived and prices bounced up strongly from the 5-week moving average support of $1,483 to $1,500 on Thursday and have found acceptance above $1,500 at press time. 

Gold’s rebound from the post-Fed low could be associated with the drop in the US yields. Notably, the 10-year yield is currently trading at 1.75% – down 25 basis points from the previous week’s high of 1.90%. 

Also, escalating tensions in the gulf likely put a haven bid under gold. Iran on Thursday warned of an all-out war if attacked by the US or Saudi Arabia. The US has accused Iran of attacking Saudi oil facilities and President has announced a new round of sanctions against Iran’s national bank. 

Looking forward

Gulf tensions will likely keep Gold better bid next week. The gains, however, could be capped around Sept. 12’s high of $1,524 by the US-China trade optimism. President Trump on Friday said that his administration was making a lot of progress with China and lifted tariffs on over 400 Chinese products, according to Reuters. 

Further, an above-forecast US Personal Spending (Aug) and Core Personal Expenditure (PCE) price index could weigh over the safe-haven metal. Note that the Fed cut rates by 25 basis points on Sept. 18 but the officials were split on the need for further easing in the near-term. 

As a result, many observers are convinced that the Fed would stand pat for the rest of the year. That narrative would become entrenched in the market if the US Personal Spending data, due on Friday, blows past expectations.

The final reading for the US second-quarter Gross Domestic Product (GDP) will be released on Thursday. That backward-looking data will likely be ignored by markets unless there is a significant upward or downward revision to estimates released last month. Also, note that gold may take a beating if the gulf tensions ease.

GMT
Event
Vol.
Actual
Consensus
Previous
Friday, Sep 20
19:30
 
 
$-16.4K
19:30
 
 
$269.7K
19:30
 
 
428.2K
Monday, Sep 23
12:30
 
-0.35
-0.36
13:45
 
50.3
50.3
13:45
 
49.6
50.7
13:45
 
51.5
50.7
13:50
 
 
15:30
 
 
1.945%
15:30
 
 
1.87%
Tuesday, Sep 24
12:55
 
 
-0.9%
12:55
 
 
5.4%
13:00
 
2.2%
2.1%
13:00
 
0.3%
0.2%
14:00
 
 
14:00
 
-11
1
17:00
 
 
1.516%
20:30
 
 
0.592M
Wednesday, Sep 25
11:00
 
 
-0.1%
14:00
 
0.660M
0.635M
14:00
 
3.9%
-12.8%
14:30
 
 
1.058M
17:00
 
 
1.365%
Thursday, Sep 26
12:30
 
212K
208K
12:30
 
 
212.25K
12:30
 
1.672M
1.661M
12:30
 
2.4%
2.5%
12:30
 
2%
2%
12:30
 
0.3%
0.2%
12:30
 
$-77.327B
$-72.340B
12:30
 
0.4%
2.3%
12:30
 
1.7%
1.7%
14:00
 
-1.9%
-0.3%
14:00
 
0.3%
-2.5%
14:30
 
78B
84B
15:00
 
-3.9
-2.0
17:00
 
 
1.489%
Friday, Sep 27
12:30
 
0.2%
0.2%
12:30
 
1.3%
1.4%
12:30
 
0.4%
0.1%
12:30
 
0.2%
0.2%
12:30
 
0.3%
0.6%
12:30
 
1.6%
1.6%
12:30
 
-3.1%
2.0% Revised from 2.1%
12:30
 
1.0%
0.2% Revised from 0.4%
12:30
 
0.1%
1.3% Revised from 1.4%
12:30
 
0.1%
-0.4%
14:00
 
92.1
92.0
17:00
 
 
719

Technical Outlook

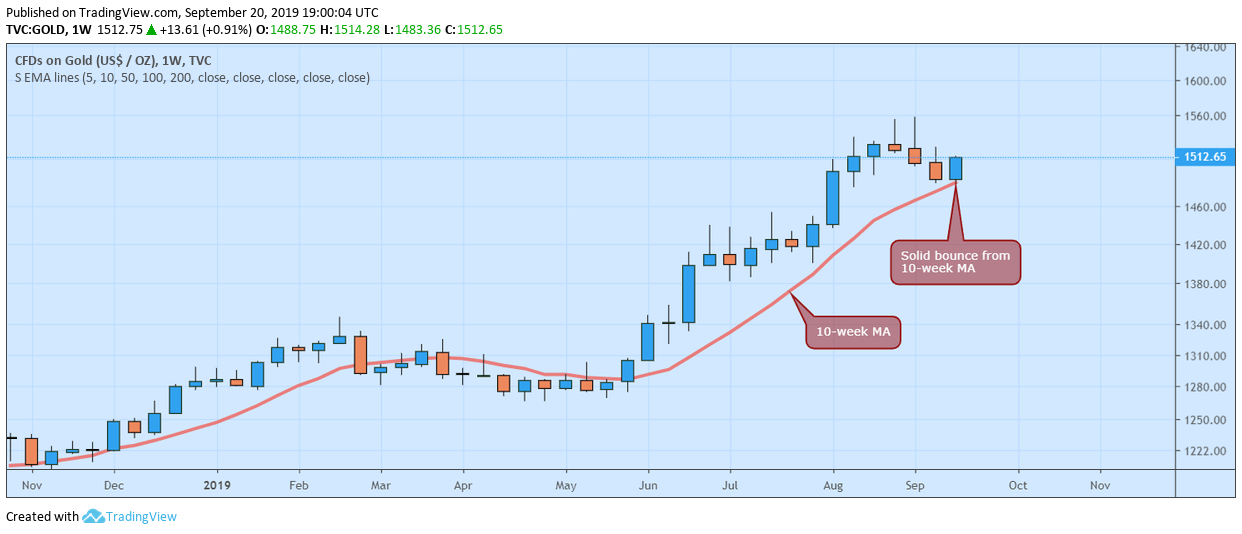
The solid recovery from the 10-week moving average has reinforced the bullish view put forward by that ascending line. 

Further, the 4-hour chart is reporting a pennant breakout – a sign the pullback from recent highs above $1,550 has ended and prices could test resistance at $1,524. A daily close above that level will invalidate Sept. 12’s Doji candle and could yield rise to $1,557. 

The outlook would turn bearish if the pair finds acceptance below the 50-day MA, which is now sidelined near $1,484. 

Weekly chart
4-hour chart

Daily chart

1 Week
Avg Forecast 1502.11
100.0%78.0%45.0%040455055606570758085909510010500.10.20.30.40.50.60.70.80.910
  • 45% Bullish
  • 33% Bearish
  • 22% Sideways
Bias Bullish
1 Month
Avg Forecast 1505.60
100.0%90.0%30.0%03040506070809010000.10.20.30.40.50.60.70.80.910
  • 30% Bullish
  • 60% Bearish
  • 10% Sideways
Bias Bearish
1 Quarter
Avg Forecast 1507.78
100.0%89.0%33.0%03040506070809010000.10.20.30.40.50.60.70.80.910
  • 33% Bullish
  • 56% Bearish
  • 11% Sideways
Bias Bearish

Author

Omkar Godbole

Omkar Godbole

FXStreet Contributor

Omkar Godbole, editor and analyst, joined FXStreet after four years as a research analyst at several Indian brokerage companies.


More from Omkar Godbole
Share:

Editor's Picks

GBP/USD advances to 1.3650 region despite weak sales data

GBP/USD trades in positive territory at around 1.3650 in the European session on Friday. Although Retail Sales data from the UK came in weaker than expected, the pair holds its ground, supported by the persistent US Dollar (USD) weakness following the Treasury Department's decision to boost long-term bond purchases earlier in the week.

EUR/USD holds near 1.1700 ahead of US PMI data

EUR/USD consolidates its weekly gains at around 1.1700 in the European session on Friday following the mixed PMI prints from Germany and the Eurozone. Investors await preliminary August PMI surveys for the US, while the persistent USD weakness allows the pair to keep its footing.

Gold hits fresh high since June above $4,550 as receding Fed hike bets undermine USD

Gold sticks to modest gains near its highest level since early June, touched earlier this Friday, and trades just above $4,550 heading into the European session. The commodity is looking to build on the breakout momentum above a technically significant 200-day Simple Moving Average amid a weaker US Dollar. Traders scaled back their bets on an immediate interest rate hike by the Fed after the latest US inflation data released last week signaled signs of cooling price pressures.

Bulls in control with Bitcoin heading toward $80,000, Ethereum $2,500, XRP $1.50
Bitcoin (BTC), Ethereum (ETH) and Ripple (XRP) are extending their rallies as bullish momentum strengthens and continue to cheer the US Treasury’s decision to double its debt buyback operations. BTC has climbed nearly 20%, ETH over 25% and XRP nearly 30% so far this week.
The great bond-market repricing: Why deficits, geopolitics and AI are driving long-term yields higher

The biggest move in financial markets right now may be happening in an asset class that many equity and FX investors rarely watch closely: government bonds. Long-term yields have surged across the US, Europe, the UK and Japan, with several benchmarks reaching levels not seen for more than a decade.

$20 billion offered, $2 billion taken: Why Treasury doubled its buyback cap

The US Treasury moved off its own calendar on Wednesday, and that is the part worth sitting with. At 12:32 GMT, the department said it would at least double the size of liquidity support buyback operations in the 10-year to 20-year and 20-year to 30-year sectors, lifting the maximum from $2 billion per operation to at least $4 billion, effective September 9 and running to November 4.