Gold Price Forecast: No relief for XAU/USD buyers despite the US debt deal
- Gold price is back in the red, testing the critical 100-Daily Moving Average support at $1,934.
- The US Dollar pulls back, along with US Treasury bond yields, on debt-deal optimism.
- Gold price remains vulnerable amid rising odds of a June Fed rate hike and an impending Bear Cross.

Gold price is resuming its downtrend after a brief pullback on Friday, kicking off the week on the wrong footing. The United States Dollar (USD) is retreating from two-month tops along with US Treasury bond yields as investors cheer the US debt deal reached on Sunday.
United States averts a default
Risk sentiment remains in a firmer spot at the start of the week. US S&P 500 futures gain 0.25% as markets breathe a sigh of relief, courtesy of a weekend deal reached by US President Joe Biden and House Speaker Kevin McCarthy to suspend the government's $31.4 trillion debt ceiling until 2025, averting an economic catastrophe.
Amidst this optimism, the US Dollar is staging a minor correction from two-month highs against its major counterparts, tracking the sluggish performance in US Treasury bond yields. Despite the renewed weakness in the Greenback, Gold price looks vulnerable as markets ward off risks of a potential US recession even though the debt deal still needs to get passed via a narrowly-divided Congress.
The latest downtick in the Gold price could also be attributed to rising expectations that the US Federal Reserve (Fed) will deliver a 25 basis points (bps) rate hike in June. Markets are currently pricing in a 62% probability of a 25 bps rate hike next month, compared with odds of about 12% seen a week ago. Strong United States economic data, coupled with the US debt-ceiling extension, could offer the Fed some leeway to continue its tightening cycle one last time in June.
Data released Friday showed that the headline Personal Consumption Expenditure (PCE) Price Index rose 0.4% MoM in April, pushing the annual rate to 4.4% from 4.2% previously. The Core PCE, the Federal Reserve’s favorite inflation gauge, advanced 0.4% monthly and 4.7% on a yearly basis. Meanwhile, the United States GDP increased at an annualized rate of 1.3% in the first quarter, an increase from the first reading of 1.1% and above economists' estimates of 1.1%.
In the day ahead, the broader market sentiment will remain the key driver as most of the major European markets and the US markets are closed this Monday. Investors will take cues from the central banks’ expectations ahead of Wednesday’s Congressional vote and Friday’s United States Nonfarm Payrolls data.
Gold price technical analysis: Daily chart
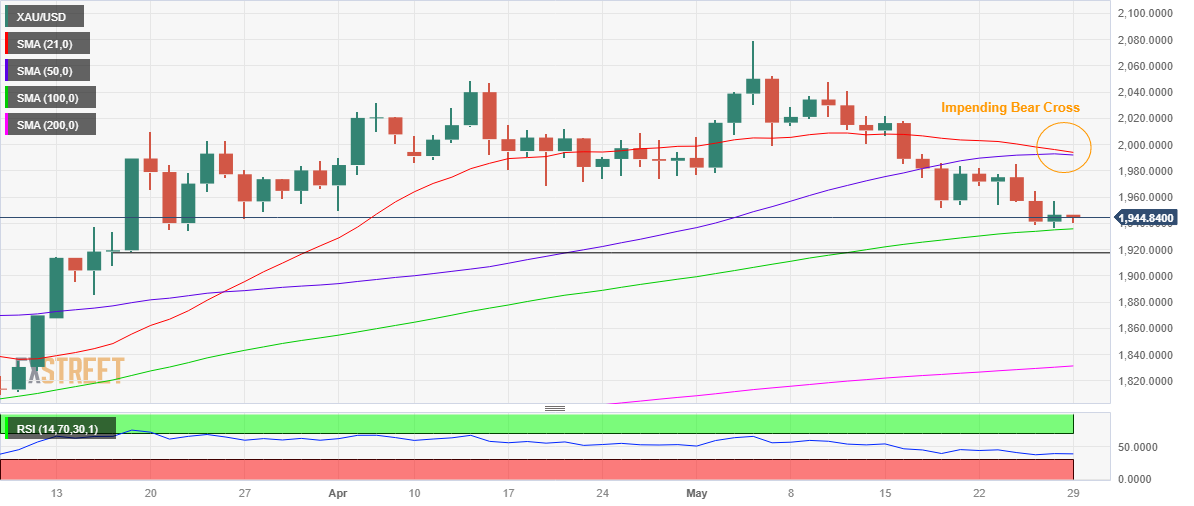
As observed on the daily chart, Gold price is challenging the bullish commitments once again at the ascending 100-daily moving average (DMA) at $1,934, having defended that key support on a weekly closing basis.
The 14-day Relative Strength Index (RSI) is pointing lower below the midline, justifying the vulnerability in Gold price. Adding credence to the bearish bias, the 21 DMA is set to pierce the 50 DMA from above, which will confirm a Bear Cross once it occurs.
Gold bears aim for the March 17 low at $1,918 on a sustained break below the 100 DMA cap. Further down, the $1,900 round figure could come into play.
Alternatively, immediate resistance is seen at the $1,950 psychological level, above which bulls will look to retest Friday’s high at $1,957.
The $1,970 static resistance could make it an uphill task for Gold buyers on their road to recovery.
Premium
You have reached your limit of 3 free articles for this month.
Start your subscription and get access to all our original articles.
Author

Dhwani Mehta
FXStreet
Residing in Mumbai (India), Dhwani is a Senior Analyst and Manager of the Asian session at FXStreet. She has over 10 years of experience in analyzing and covering the global financial markets, with specialization in Forex and commodities markets.


