Gold Price Forecast: Bear Cross cautions XAU/USD buyers ahead of US inflation test
- Gold price looks to build on the previous recovery toward $2,650 early Wednesday.
- Bear Cross and bearish RSI on the daily chart continue to caution Gold buyers.
- The Gold price recovery hinges on the US data, including the PCE inflation.

Gold price stays on the front foot in Asian trading on Wednesday, looking to extend the previous recovery from six-day lows of $2,605. Traders gear up for a slew of top-tier US economic data releases heading into the Thanksgiving holiday season.
Gold buyers await US PCE inflation data
Early Wednesday, the persistent weakness surrounding the US Dollar (USD) and the US Treasury bond yields offset easing geopolitical tensions between Israel and Lebanon, allowing Gold buyers to come up for air for the second day.
The sentiment around the US Dollar remains undermined following US President-elect Donald Trump's selection of Scott Bessent as Treasury Secretary. Bessent, a fiscal conservative, assured the US bond markets, spelling doom for the US Treasury bond yields and eventually for the USD.
A ceasefire between Israel and Lebanon helped reduce the haven demand for the Greenback, exerting additional downward pressure even though the Minutes of the US Federal Reserve (Fed )November meeting showed that officials were divided on further rate cuts.
Reuters reported, “a ceasefire between Israel and Iran-backed group Hezbollah came into effect at 0200 GMT on Wednesday after U.S. President Joe Biden said both sides accepted an agreement brokered by the United States and France.”
Meanwhile, markets continue to price in over 60% probability of the Fed lowering interest rates by 25 bps next month, according to the CME Group’s FedWatch Tool, despite a less dovish Fed Minutes.
Therefore, the Gold price remains supported amid sustained dovish Fed expectations and uncertainty surrounding global trade prospects during Donald Trump’s presidency. This is especially true after he announced 25% tariffs on goods imported from the US into Canada and Mexico on Tuesday. At the same time, he slapped 10% additional tariffs on US imports into China.
Hong Kong Census and Statistics Department data showed on Tuesday that China's net gold imports via Hong Kong in October fell from September and were down 43% from the previous year. Traders digest the data as attention turns toward the upcoming US macro news, with the Core Personal Consumption Expenditure (PCE) Price Index in focus.
The Fed’s preferred inflation gauge and the weekly Jobless Claims will help shape market expectations for future Fed rate cuts, impacting the USD and the non-interest-bearing Gold price. The core PCE Price Index is rising 2.8% YoY in October versus September’s rise of 2.7%. Meanwhile, the headline annual PCE inflation is expected to advance to 2.3% in the same period from 2.1% in September.
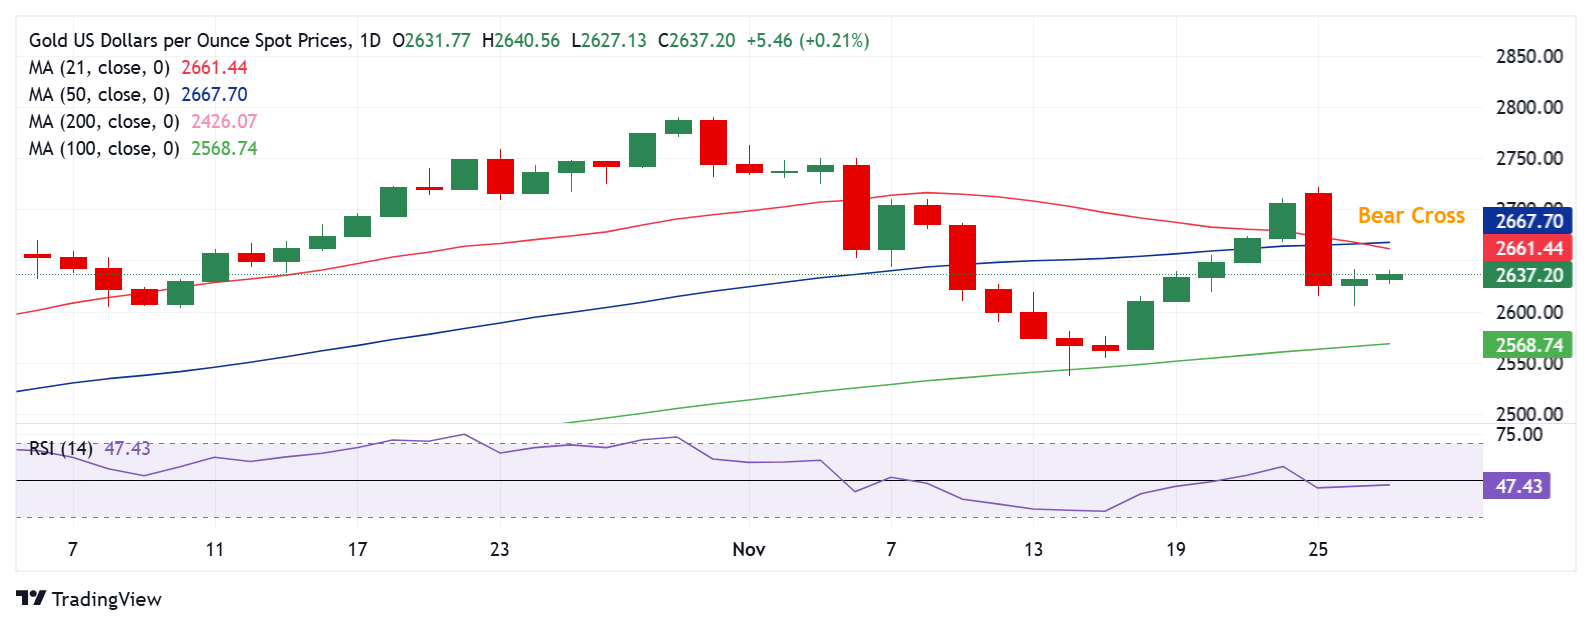
Gold price technical analysis: Daily chart
Hotter-than-expected US inflation data could raise further doubts about the Fed’s rate cut trajectory, reinforcing selling pressure around the Gold price.
The 21-day SMA crossed the 50-day SMA from above on a daily closing basis on Tuesday, confirming a Bear Cross.
Adding credence to the downside potential, the 14-day Relative Strength Index (RSI) remains below the 50 level, currently near 47.
Therefore, any upside attempts in Gold price could likely be sold into unless buyers find acceptance above the 21-day SMA and 50-day SMA crossover near $2,660.
The next topside barriers are at the $2,700 level and Monday’s high of $2,721.
Alternatively, the immediate support is at the previous day’s low of $2,605, below which a drop toward the 100-day SMA at $2,569 remains in the offing.
A sustained break below that level could challenge the November 14 low of $2,537.
Economic Indicator
Core Personal Consumption Expenditures - Price Index (YoY)
The Core Personal Consumption Expenditures (PCE), released by the US Bureau of Economic Analysis on a monthly basis, measures the changes in the prices of goods and services purchased by consumers in the United States (US). The PCE Price Index is also the Federal Reserve’s (Fed) preferred gauge of inflation. The YoY reading compares the prices of goods in the reference month to the same month a year earlier. The core reading excludes the so-called more volatile food and energy components to give a more accurate measurement of price pressures." Generally, a high reading is bullish for the US Dollar (USD), while a low reading is bearish.
Read more.Next release: Wed Nov 27, 2024 13:30
Frequency: Monthly
Consensus: 2.8%
Previous: 2.7%
Source: US Bureau of Economic Analysis
After publishing the GDP report, the US Bureau of Economic Analysis releases the Personal Consumption Expenditures (PCE) Price Index data alongside the monthly changes in Personal Spending and Personal Income. FOMC policymakers use the annual Core PCE Price Index, which excludes volatile food and energy prices, as their primary gauge of inflation. A stronger-than-expected reading could help the USD outperform its rivals as it would hint at a possible hawkish shift in the Fed’s forward guidance and vice versa.
Author

Dhwani Mehta
FXStreet
Residing in Mumbai (India), Dhwani is a Senior Analyst and Manager of the Asian session at FXStreet. She has over 10 years of experience in analyzing and covering the global financial markets, with specialization in Forex and commodities markets.


