Gold Price Forecast: $2,530 remains a tough nut to crack for XAU/USD buyers
- Gold price rebounds early Thursday but within the recent familiar range.
- The US Dollar retreats with Treasury bond yields amid risk-aversion.
- Nvidia’s guidance and hawkish Fed commentary support risk-off flows.
- Technically, the path of least resistance appears to the north for Gold price.

Gold price is attempting a minor recovery while holding within this week’s familiar range, having regained $2,500 early Thursday. Gold price capitalizes on broad risk aversion, as traders now shift their focus to the second estimate of the US Gross Domestic Product (GDP) and Pending Home Sales data due later this Thursday.
Gold price looks to US Q2 GDP and risk trends
In the meantime, they assess the American AI giant’s, Nvidia, earnings report alongside hawkish comments from Atlanta Federal Reserve (Fed) Bank President Raphael Bostic. Both these events have contributed to the extension of risk-off flows into Asian trading.
Nvidia shares tanked 7% in post-market trading, despite a 122% revenue growth and $50 billion buyback, as the company’s sales forecast disappointed the lofty market expectations. The chipmaker said that revenue for the ongoing quarter would be $32.5 billion, lower than the average analyst estimate of $37.9 billion. Further, Nvidia's gross margin fell to 75.1% from 78.4% in the previous quarter.
Early Thursday, Atlanta Fed Chair Bostic pushed back against the first interest rate due likely in September, noting that “inflation has come down faster than expected, unemployment has risen farther than thoughts. This means we should pull forward rate cut to third-quarter.”
“It would not be good to cut rates only to have to raise them again,” he added. Markets continue to price in a 35% chance that the Fed will lower rates in September by 50 basis points (bps) while the odds for a 25 bps cut stand at 65%, according to CME Group’s FedWatch Tool.
The hawkish Fed commentary seems to have little to no impact on the market’s pricing of the Fed’s interest-rate outlook, aiding the rebound in the Gold price. A broad-based US Dollar retreat alongside the US Treasury bond yields also bodes well for Gold price heading into the US Q2 GDP second estimate.
US Annualized GDP is expected to hold steady at 2.8% QoQ in Q2, the second estimate will likely show.
Gold price technical analysis: Daily chart
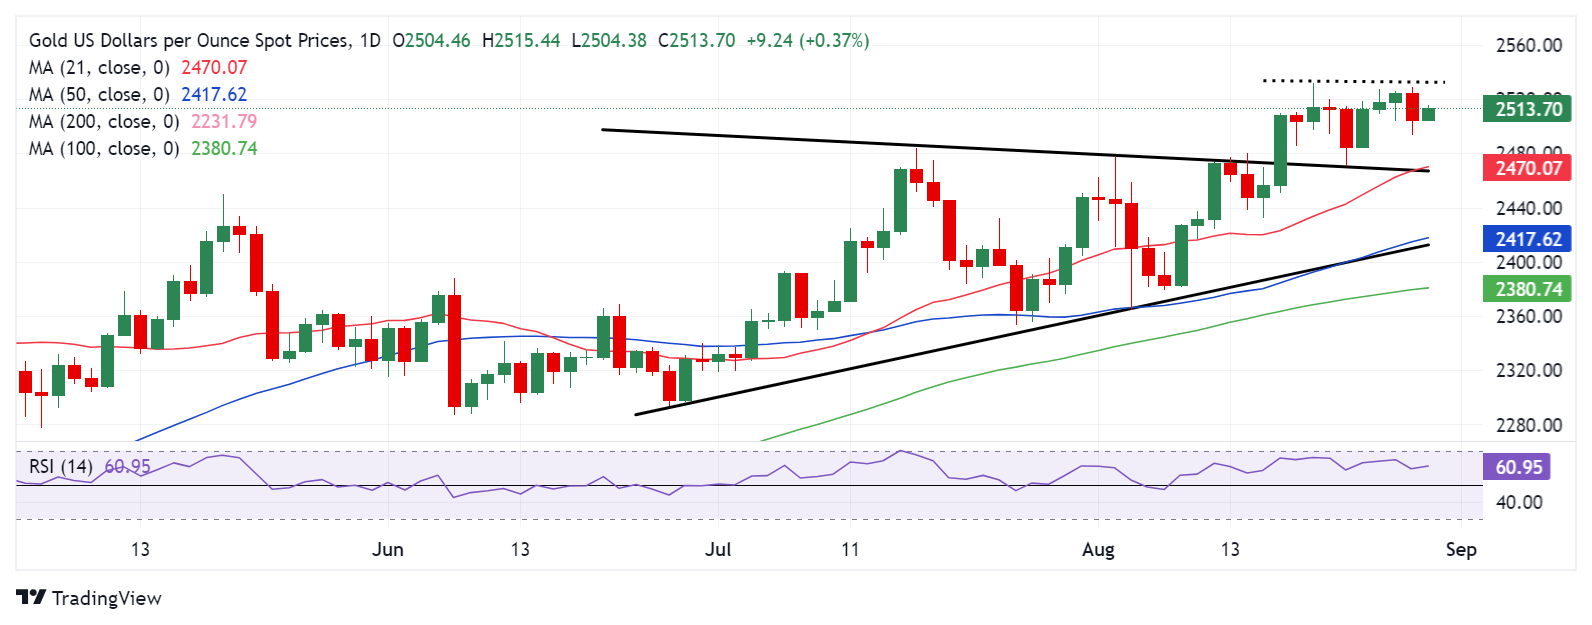
The short-term technical outlook for Gold price remains more or less the same, with a fresh push higher in the offing while above the triangle resistance-turned-support at $2,469.
The 21-day Simple Moving Average (SMA) closes in on that level, making it a strong support.
Gold price confirmed an upside break from a symmetrical triangle a couple of weeks ago.
Meanwhile, the 14-day Relative Strength Index (RSI) turns north again above 50, currently near 62, suggesting that there is more room for upside.
Gold buyers need to recapture the record high of $2,532 to take on the next key barrier at the $2,550 level.
Acceptance above the latter could challenge the $2,600 round level en route to the triangle target, measured at $2,660.
Alternatively, the initial demand area is seen at the $2,500 threshold for Gold buyers, below which Friday’s low of $2,485 will be challenged.
A sustained breach of the latter could expose the downside toward the abovementioned triangle resistance-turned-support at $2,469.
Economic Indicator
Gross Domestic Product Annualized
The real Gross Domestic Product (GDP) Annualized, released quarterly by the US Bureau of Economic Analysis, measures the value of the final goods and services produced in the United States in a given period of time. Changes in GDP are the most popular indicator of the nation’s overall economic health. The data is expressed at an annualized rate, which means that the rate has been adjusted to reflect the amount GDP would have changed over a year’s time, had it continued to grow at that specific rate. Generally speaking, a high reading is seen as bullish for the US Dollar (USD), while a low reading is seen as bearish.
Read more.Next release: Thu Aug 29, 2024 12:30 (Prel)
Frequency: Quarterly
Consensus: 2.8%
Previous: 2.8%
Source: US Bureau of Economic Analysis
The US Bureau of Economic Analysis (BEA) releases the Gross Domestic Product (GDP) growth on an annualized basis for each quarter. After publishing the first estimate, the BEA revises the data two more times, with the third release representing the final reading. Usually, the first estimate is the main market mover and a positive surprise is seen as a USD-positive development while a disappointing print is likely to weigh on the greenback. Market participants usually dismiss the second and third releases as they are generally not significant enough to meaningfully alter the growth picture.
Author

Dhwani Mehta
FXStreet
Residing in Mumbai (India), Dhwani is a Senior Analyst and Manager of the Asian session at FXStreet. She has over 10 years of experience in analyzing and covering the global financial markets, with specialization in Forex and commodities markets.