Gold Price Annual Forecast: Will 2023 be the year Gold shines?
- Gold price looks to end 2022 flat at around $1,800.
- Fed's policy outlook and performance of Chinese economy will impact Gold price in 2023.
- Market positioning and technical outlook suggest that XAU/USD could stay bullish next year.

Gold price started 2022 in an indecisive manner after having spent the last quarter of 2021 fluctuating at around $1,800. Toward the end of February, XAU/USD rose sharply and reached its highest level since August 2020 at $2,070 in early March. During the second and third quarters, however, Gold price fell substantially and registered losses for seven straight months, coming in within a touching distance of $1,600 for the first time since April 2020 in September. Gold price recovered decisively and gained more than 8% in November and managed to continue to edge higher in the first couple of weeks of December, returning to the mid-point of its annual range near $1,800.
Gold price in 2023 will be driven by two major factors: The Federal Reserve’s monetary policy and the performance of the Chinese economy. To have a better understanding of the big picture, we will also take a look at market positioning and supply-side dynamics.
Gold price in 2022: A year in review
Toward the end of 2021, the Federal Reserve warned markets that inflation was here to stay and acknowledged they have done a bad job forecasting inflation and realizing how entrenched it had become. With Fed policymakers clearly communicating their intentions to tighten the policy to battle inflation from the beginning of the year, the 10-year US Treasury bond yield gained over 17% in January and climbed toward 2%, causing the inversely-correlated XAU/USD to lose nearly 2% on a monthly basis.
On February 24, Russia launched a large-scale invasion of Ukraine, which Russian President Vladimir Putin called a “special military operation.” Two days later, on February 26, Western allies announced significant sanctions against Russia and eventually excluded Russia from global payment systems. Gold found demand as a safe haven amid escalating geopolitical tensions and gathered bullish momentum, rising above $2,000 in early March.
Inflation, Fed and US T-bond yields
Although geopolitical tensions remained high, the Fed’s decision to hike the policy rate by 25 basis points to the range of 0.25-0.50.% after having kept it at 0-0.25% for two years forced XAU/USD to retrace a large portion of its monthly advance in March.
From that point on, the Fed continued to tighten its policy rate at an accelerating pace while inflation proved to be even stronger and more persistent than initially estimated. The Consumer Price Index (CPI) soared to 9.1% on a yearly basis in June, marking the strongest pace of increase in prices since November 1981.
US Consumer Price Index (YoY)
In May, the Fed raised its policy rate by 50 bps before opting for 75 bps hikes in June, July, September and November.
Fed policy rate
During the Fed’s aggressive tightening period, the yield on the benchmark 10-year US Treasury bond continued to rise sharply, reaching its highest level in 15 years above 4.3% in October. Gold, as a low-yielding asset, remained inversely correlated with US T-bond yields and stayed under constant bearish pressure.
As the Fed’s unprecedented rate hikes during the second and third quarters of the year revealed the policy divergence between the US and other major central banks, especially the European Central Bank and the Bank of Japan, the US Dollar became the go-to asset for investors, with Gold losing out. The US Dollar Index, which tracks the US Dollar’s performance against a basket of six major currencies, rose from 95.65 in early January to a multi-decade high of 114.78 by late September, gaining nearly 20% during that period.
Following the November policy meeting, the Fed noted in its policy statement that policymakers will take cumulative tightening and policy lags into account when determining the pace of future rate hikes. This comment caused markets to price in a smaller, 50 bps, rate increase in December. Consequently, the 10-year US T-bond yield turned south and helped Gold price rise decisively in November.
Moreover, inflation started to decline consistently in the third quarter of the year and the annual CPI and Core CPI stood at 7.1% and 6%, respectively, in November. At its last policy meeting of the year, the Fed hiked its policy rate by 50 basis points to the range of 4.25-4.5%. The Summary of Economic Projections (SEP), the so-called dot plot, revealed that the median terminal rate projection of policymakers rose to 5.1% from 4.6% in September’s SEP. Although the hawkish dot plot helped the US Dollar limit its losses, Gold price didn’t have a difficult time holding its ground with the 10-year US T-bond yield stabilizing at around 3.5% in the first half of December.
China’s zero-Covid policy
The broad-based US Dollar strength also weighed on Gold’s demand as the precious metal became more expensive to purchase, especially in India and China, two of the world's biggest Gold consumers. In fact, the Indian Rupee slumped to an all-time low against the US Dollar in October with USD/INR rising above 83.
Meanwhile, China stuck to its zero-Covid policy to deal with the rising number of cases for the first three quarters of the year, imposing city-wide lockdowns, ramping up restrictions and forcing citizens to remain in quarantine centres. As the west managed to move on from the pandemic by strengthening vaccinations and improving treatments to bring down fatality rates, China's stubborn approach caused supply-chain issues to remain in place for longer than expected and weighed on the global economic activity. Furthermore, the delayed re-opening of the Chinese economy didn’t allow Gold price to rebound with investors doubting a recovery in the precious metal’s demand outlook.
In the last quarter of the year, markets turned optimistic about the Fed taking its foot off the gas pedal after the annual CPI declined to 7.7% in October from 8.2% in September. Following the November policy meeting, the Fed stated that policymakers will take “cumulative tightening, policy lags and economic and financial developments” into account when determining the pace of rate hikes moving forward. Market participants began to price in a 50 bps rate increase in December. In turn, the 10-year US T-bond yield retreated toward 3.5% and XAU/USD gained more than 8% in November, snapping a seven-month losing streak.
Additionally, China started to ease restrictions despite having reported record-high daily cases in late November, reviving optimism about officials finally looking to move away from the zero-Covid policy and to focus on promoting growth.
2023 outlook
Fed policy
As of December 19, the CME Group’s FedWatch Tool shows that markets are pricing a 52.4% probability of the Fed opting for 25 bps hikes in February and March. If that were to happen, the policy rate will be 4.75-5%, slightly below the terminal rate projection in the dot plot. While speaking at the post-meeting press conference in December, FOMC Chairman Jerome Powell acknowledged that the peak rate could come down if inflation data continued to soften. Powell noted that they were expecting shelter inflation to recede in 2023 but added that inflation in the non-housing service sector, which is fundamentally related to the labor market and wages, was still uncomfortably high. Finally, Powell clarified that they were not thinking about cutting the policy rate in 2023 and reiterated that none of the policymakers had penciled in a rate cut next year in the SEP.
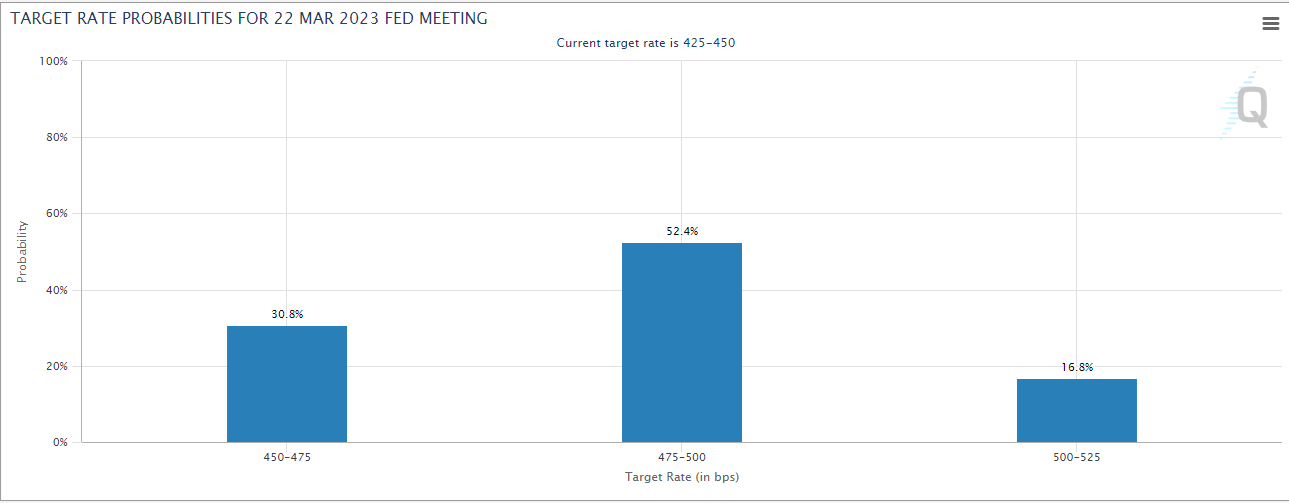
Source: CME Group
In the first quarter of the year, wage inflation and consumer inflation data will be watched closely by market participants. The US Bureau of Labor Statistics’ latest jobs report showed that Average Hourly Earnings in November rose to 5.1% on a yearly basis from 4.9% in October.
If wage inflation starts to moderate in early 2023 and the CPI continues to edge lower, market participants could start considering the possibility of the Fed executing a ‘policy pivot’ and opting for a rate cut later in the year. In that scenario, Gold price could gather bullish momentum and the US Dollar is likely to weaken against its rivals. That could also translate into improving Gold demand in China and India due to more affordable exchange rates.
On the flip side, consistently high wage inflation and an unsatisfactory softening, or strengthening, of consumer inflation should cause the Fed to refrain from evaluating a potential pivot in the policy, weighing on XAU/USD.
The performance of the US economy will be another factor to look at when assessing the Fed’s policy outlook. December’s SEP revealed that the annual Gross Domestic Product (GDP) growth forecast for 2023 declined to 0.5% from 1.2% in September. Chairman Powell and several Fed policymakers made it clear that their priority will be taming inflation and that they are ready to sacrifice growth to achieve that. During the 2007-2008 recession, Gold Price gained 16% and it rose nearly 6% in the coronavirus-induced recession of 2020. If the US economy tips into recession, US T-bond yields are likely to start pushing lower, allowing investors to choose Gold as a safe place to park their funds. On the other hand, the Fed could cling to its tight policy for longer than expected if the economy avoids a recession and cap XAU/USD’s upside.
China
In its latest report titled ‘China Economic Snapshot,’ the Organisation for Economic Co-operation and Development (OECD) said that the Chinese economy was expected to grow by 3.3% in 2022 and 4.6% in 2023.
On the same note, the International Monetary Fund (IMF) noted that China’s GDP growth was forecast to be 3.2% in 2022 before improving to 4.4% in 2023. It’s worth mentioning that the IMF’s projection assumes that China’s current zero-Covid strategy will be “gradually and safely lifted in the second half of 2023.”
The official release of the annualized GDP growth for the fourth quarter will be released in January. In the third quarter, the Chinese economy expanded by 3.9% (YoY). Considering the fact that the business activity continued to contract in the manufacturing and service sectors with the Manufacturing and Non-Manufacturing PMI data coming in below 50 in October and November - the PMI surveys for December will be released by the end of December - a slowdown in GDP growth in Q4 shouldn’t be a big surprise.
In early December, China’s National Health Commission (NHC) announced that asymptomatic cases and cases with mild symptoms will be allowed to quarantine at home. The NHC further noted that mass PCR testing will not be conducted outside schools, hospitals and nursing homes in what is seen as a gradual and cautious approach to reopening. In case China continues to move away from the zero-Covid policy, the economy is likely to gather momentum. A quicker-than-expected recovery in the Chinese economy supported by an accommodative monetary policy and fiscal policy should improve the demand outlook for Gold, providing a boost to prices. It’s also worth noting that the People’s Bank of China (PBoC) reported that Gold holdings rose to 63.67 million troy ounces as of end-November from 62.64 million in October, marking the first increase in Gold reserves in over three years.
PMI surveys will be key when assessing whether the Chinese economy is picking up steam. Once the Manufacturing and Non-Manufacturing PMIs rebound above 50 and continue to improve, investors could start positioning themselves for China performing better than projected.
Analyzing market positioning
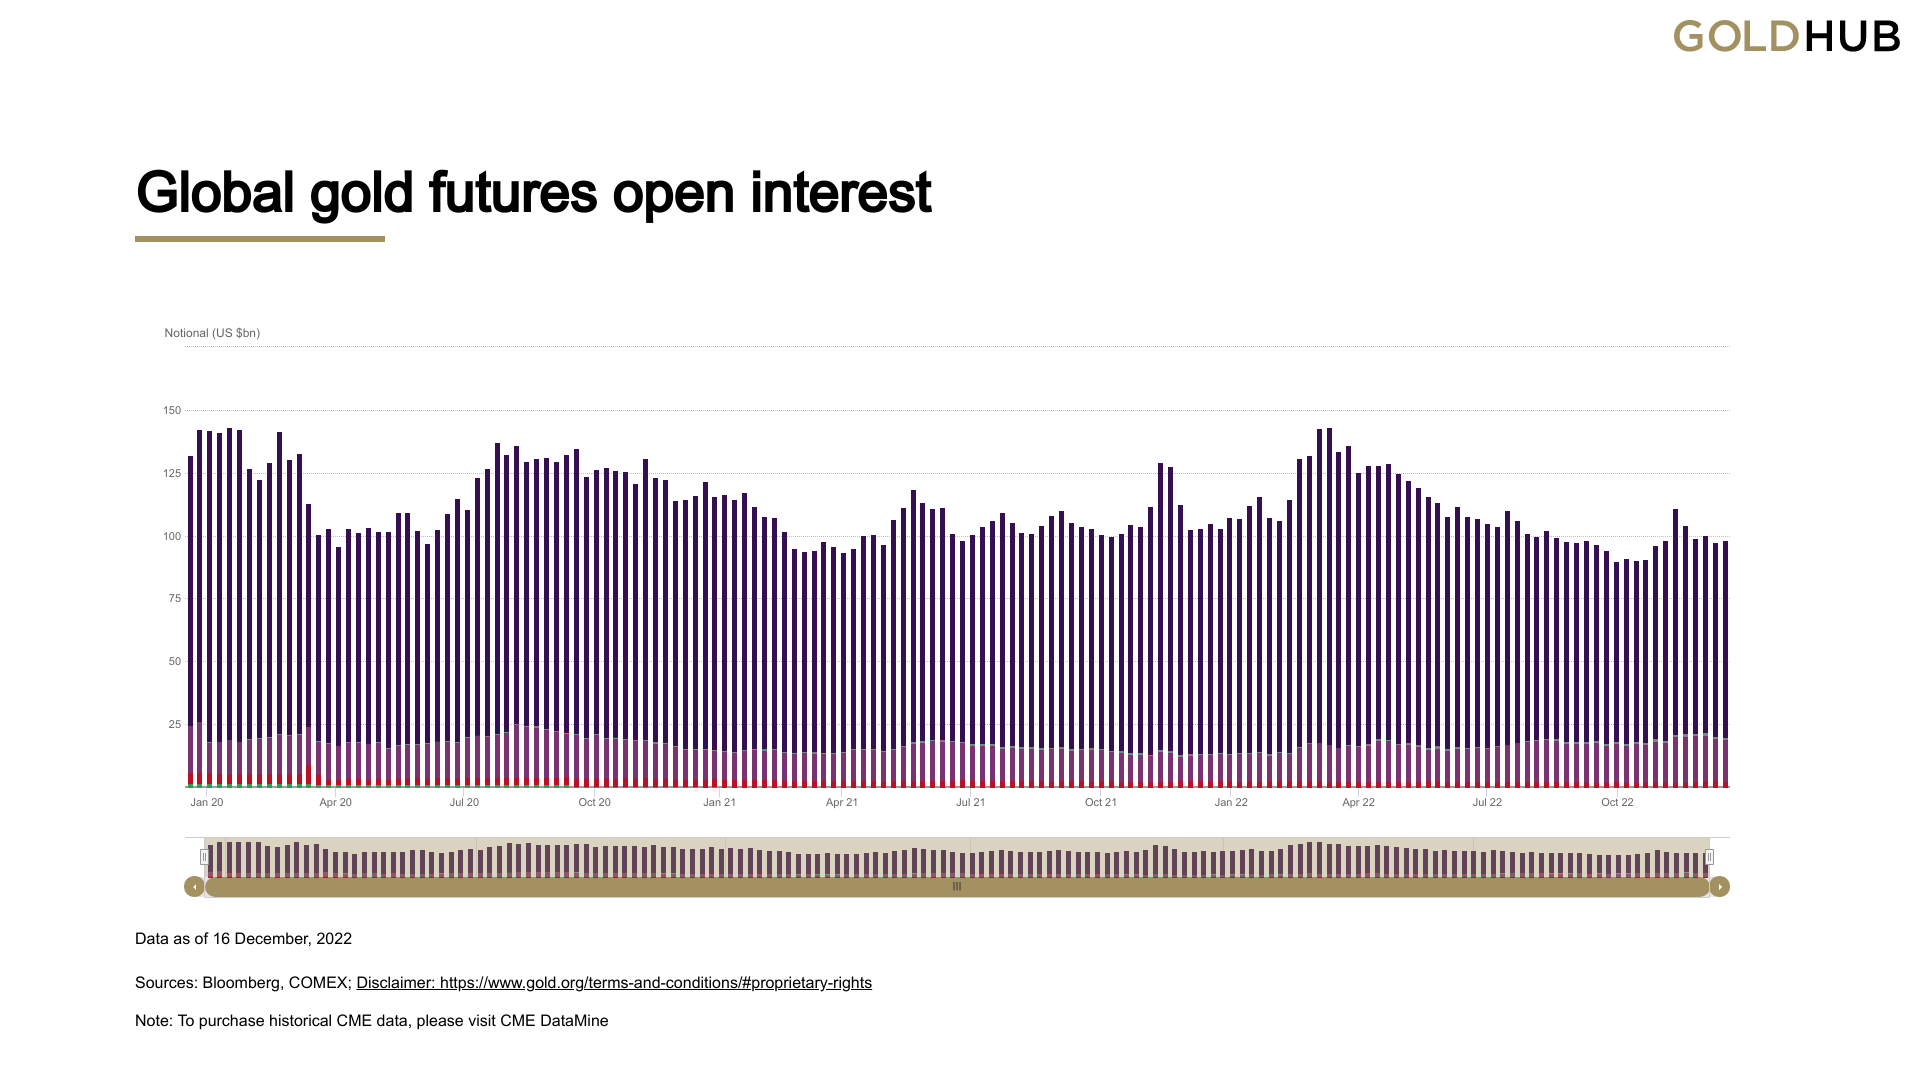
Open interest
Open interest in Gold futures exchanges, the amount of outstanding contracts, declined steadily from early March, when XAU/USD climbed above $2,000, to late October when XAU/USD touched multi-year lows near $1,600. Since early November, however, open interest has increased modestly.
Declining open interest in a falling market is generally seen as market participants giving up on their longs and liquidating their positions. Once the downtrend in open interest comes to end, however, this could be taken as a sign that market participants believe that the bottom is in place and that they are preparing to reinstate their longs.
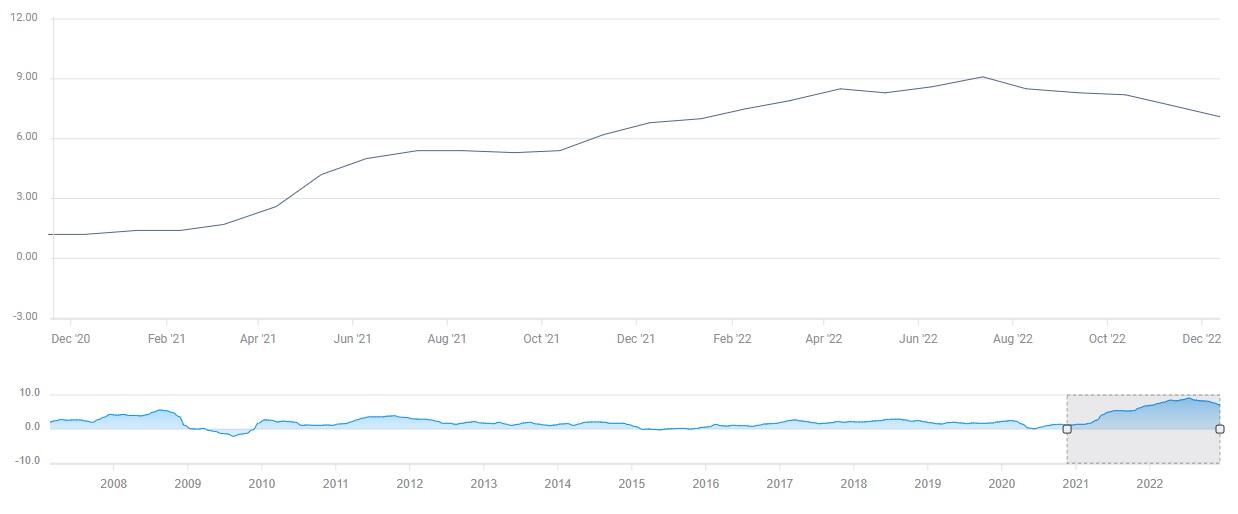
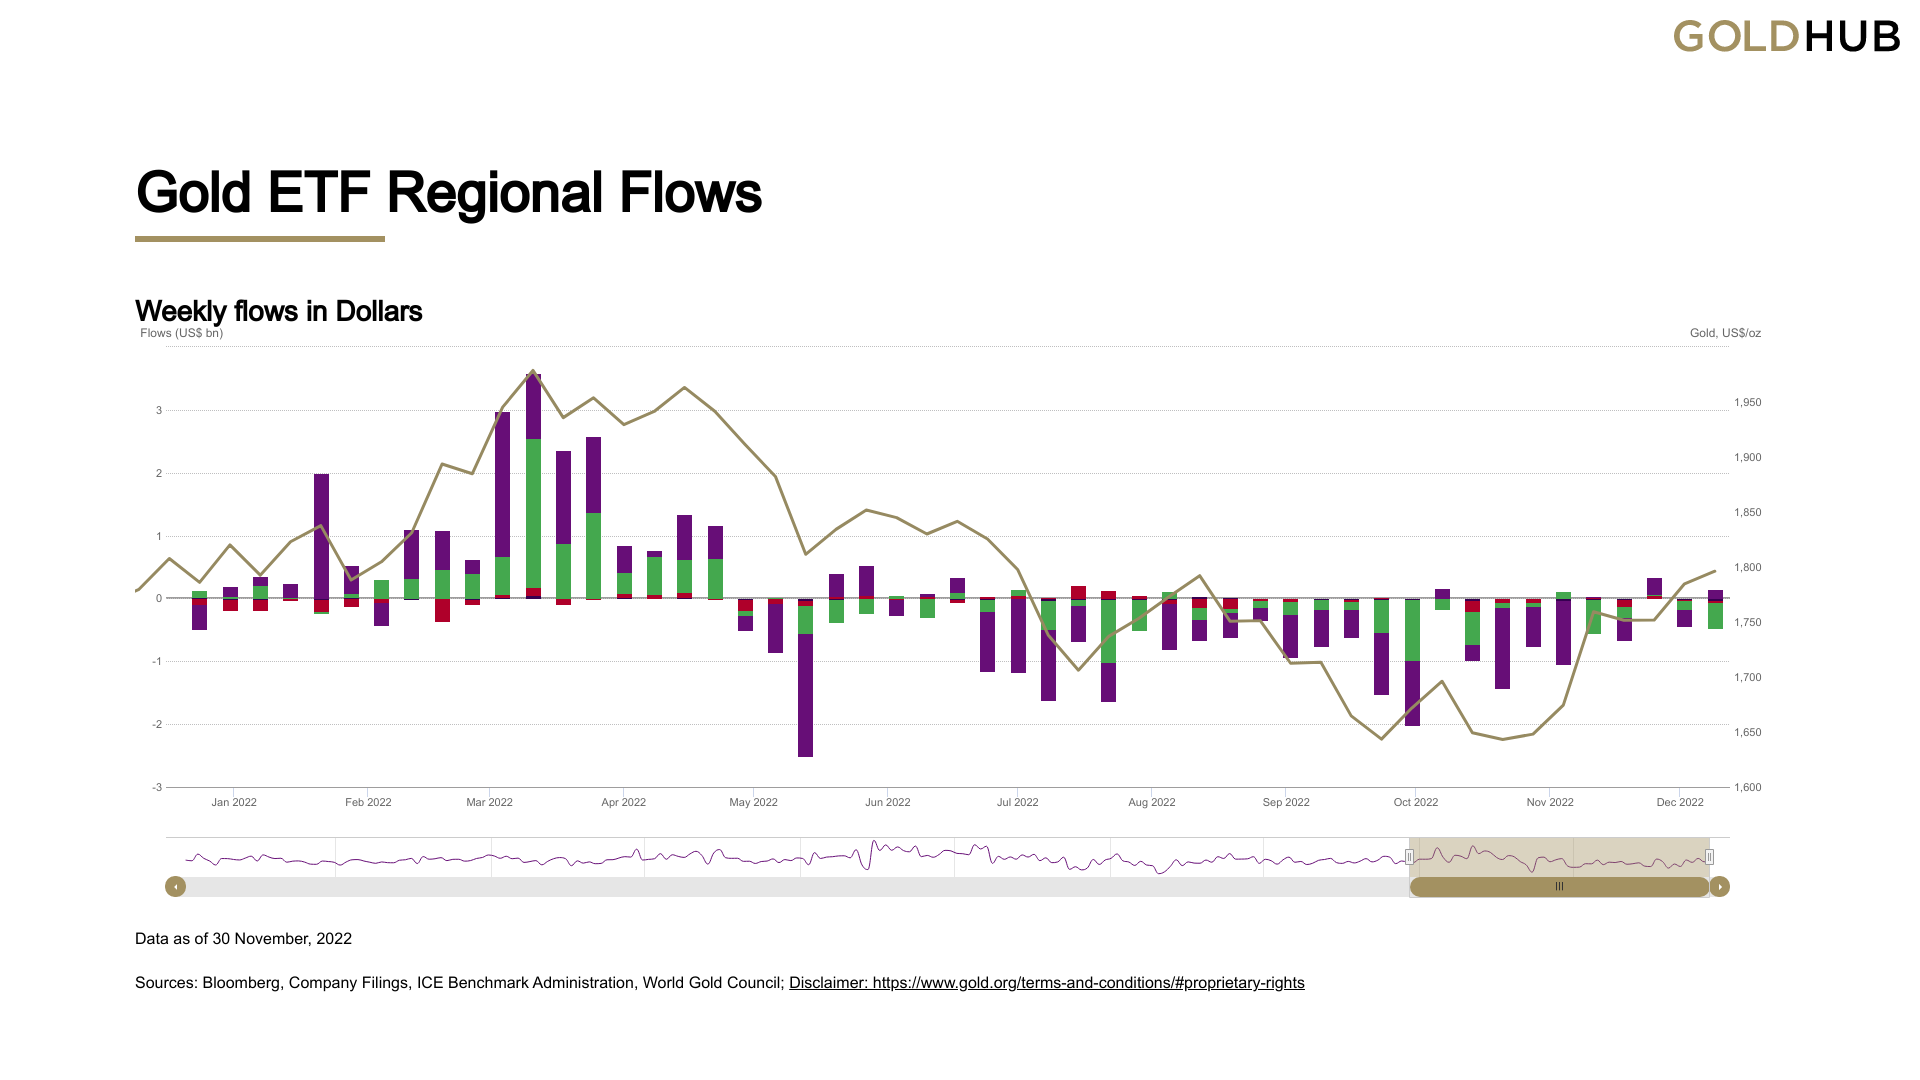
Gold ETF inflows/outflows
The chart below represents the change in Gold ETF - fully backed by physical Gold - flows in US Dollar terms from the beginning of the year until the end of November. Although this chart doesn’t yet point to a bullish bias, total outflows have been declining steadily since early October. Once there are consistent weekly inflows, this could be seen as a sign that ETFs are expecting prices to continue to increase.
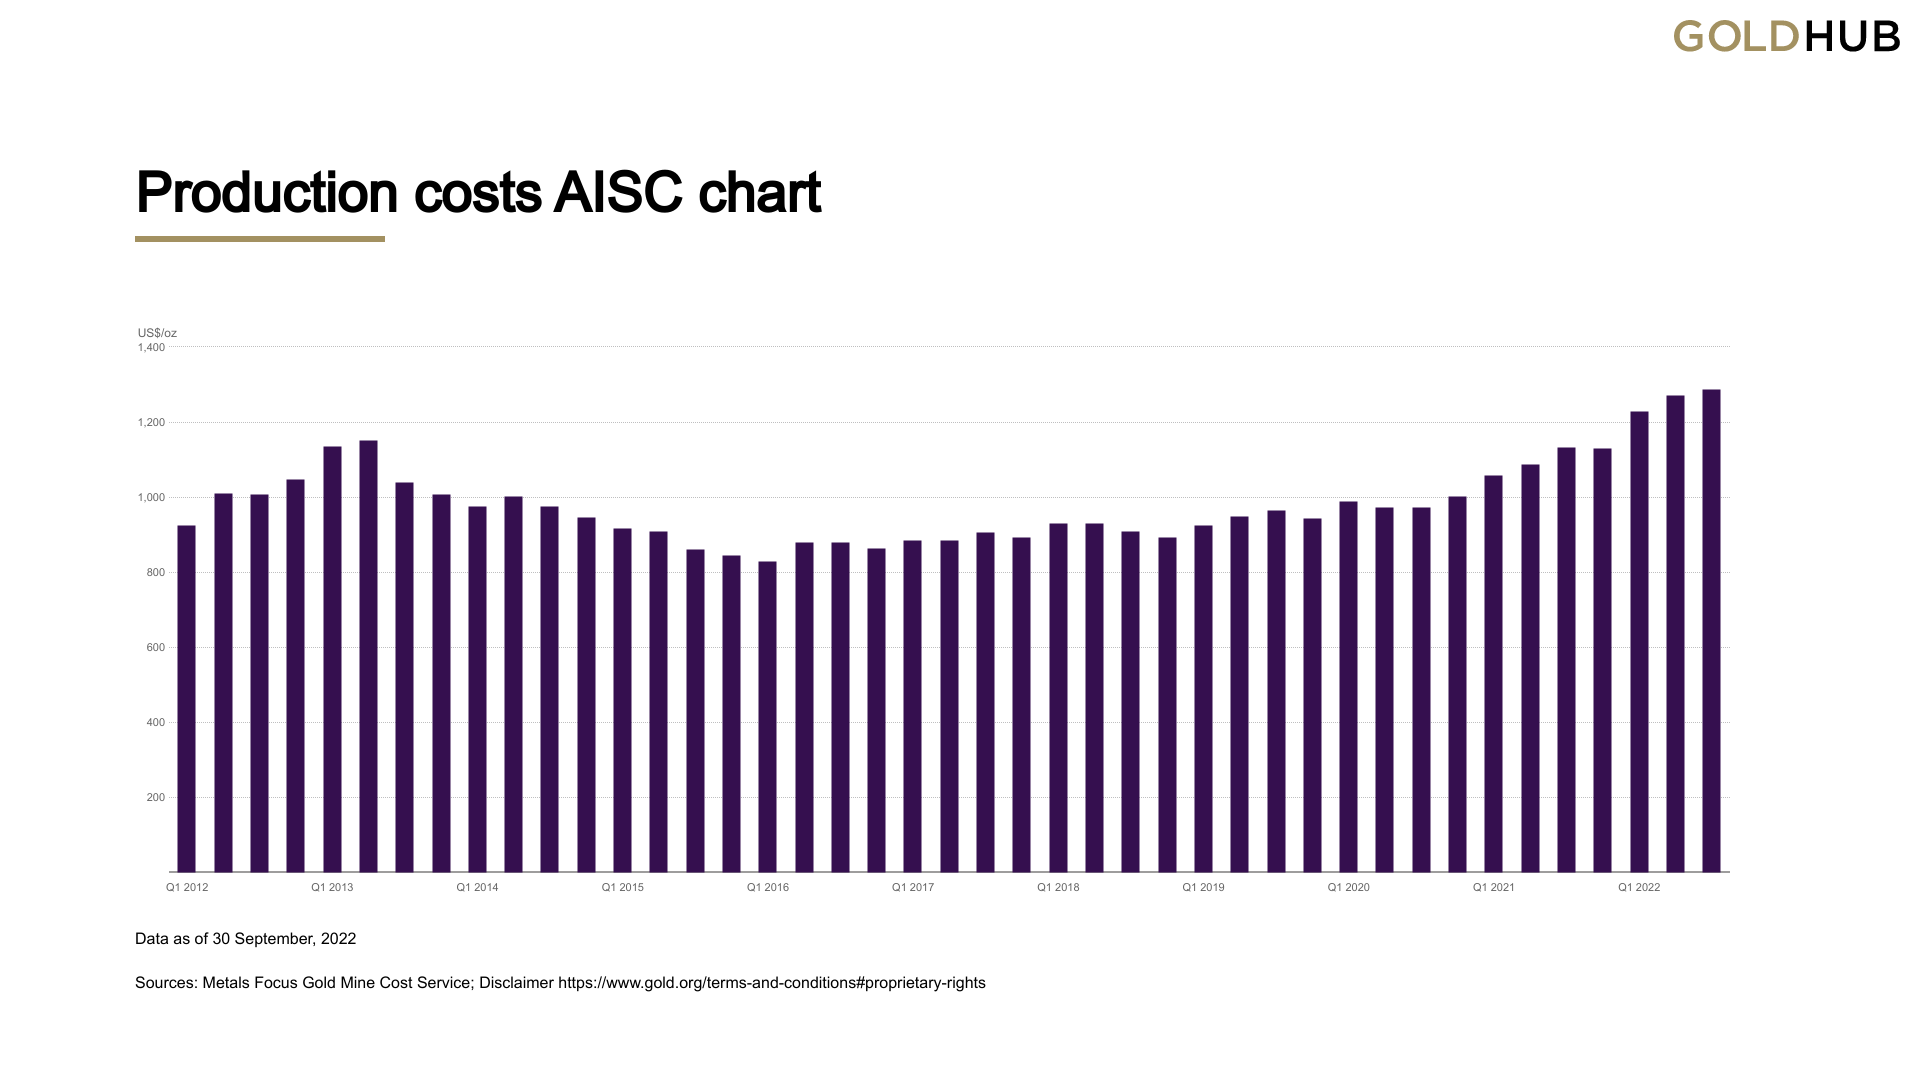
Supply-side dynamics
Arguably, demand-side dynamics have a bigger impact on Gold prices than supply-side, especially in the short and medium terms. Nevertheless, looking at costs associated with Gold mining and global output growth could give us an idea of how supply could influence XAU/USD’s price action next year.
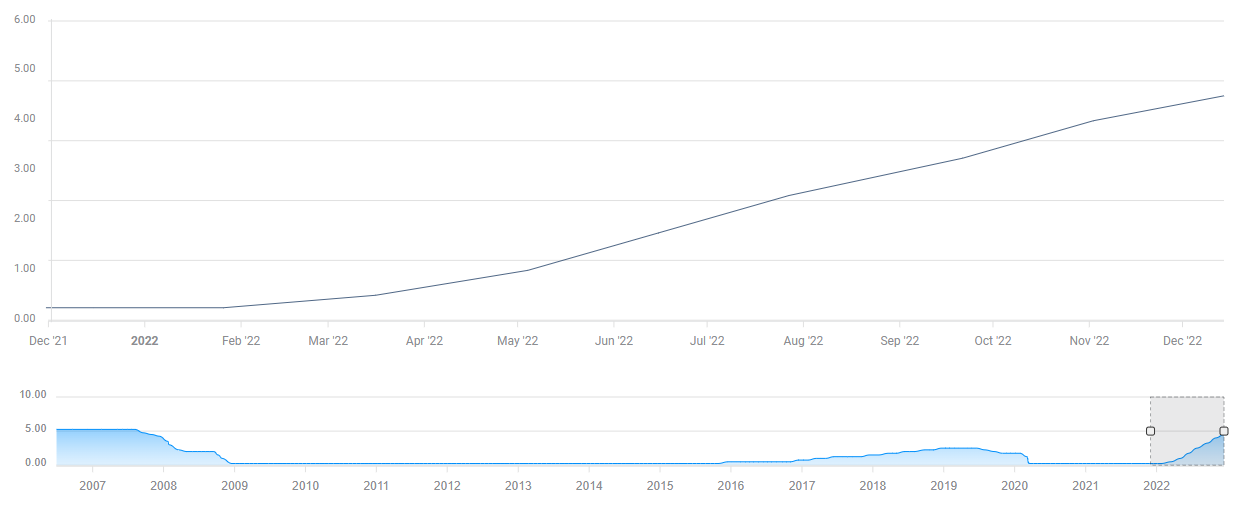
The chart below shows the change in ‘all-in sustaining costs (AISC),’ an industry-specific metric that is widely used as a measure of total expenses, per ounce of Gold. The latest available data shows that the AISC reached an all-time high of $1,289/oz in the second quarter, reflecting a nearly 20% increase on a yearly basis. Barrick Gold Corp, the world’s second-largest Gold miner, said in early November that the 9% decline in production translated into a 22.7% increase in the company’s annual AISC in the third quarter.
According to the CME Group, Gold mining production has contracted by 7% since 2016. Historically, Gold prices remained in an uptrend over the long term when gold output grew at a below-average rate of below-2%.
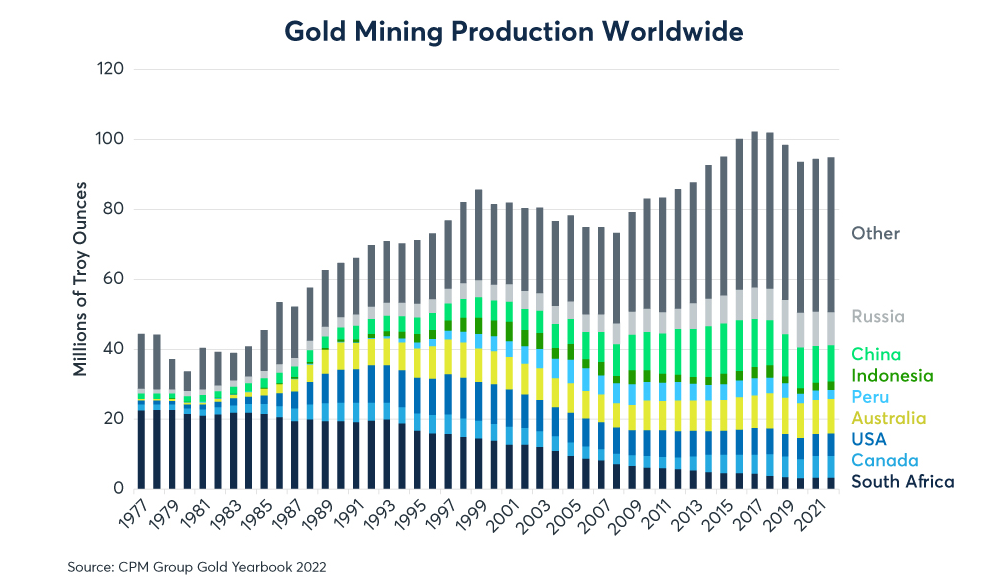
The output growth in the last couple of years has been below-average, at around 1.5% annually, and it would be surprising to see a significant increase in that figure giving record-high costs. Hence, supply-side dynamics, as they currently stand, look supportive of higher Gold prices in 2023.
Summary
Gold Price has the potential to register strong gains in 2023 but there are considerable downside risks.
Softening consumer and wage inflation in the US in the first quarter should allow markets to remain hopeful about a Fed policy pivot later in the year and leave the door open for further upside in Gold price. Combined with a strong recovery in the Chinese economy amid consistent re-opening steps, it should help the yellow metal’s demand outlook improve and support the price. As explained above, the market positioning, in terms of open interest and ETF flows, suggests that investors are placing themselves for further gains in Gold price.
Finally, the supply side could prop Gold price in case the mining output growth stays below average.
Conversely, Gold price could edge lower if the US economy avoids a recession and the Fed doubles down on the tight policy outlook with inflation not declining as desired. Additionally, a reinstatement of coronavirus restrictions in China could force market participants to reassess the demand outlook and make it difficult for Gold price to gain traction.
Gold price technical outlook
The technical outlook for Gold price turned bullish in early November as the Relative Strength Index indicator on the weekly chart climbed above 50 for the first time since May. The RSI has been moving sideways slightly below 60 since, suggesting that buyers remain in control of XAU/USD’s action. Furthermore, the pair climbed above the 200-week SMA during the uptrend that started in November.
However, Gold price has failed to reclaim the 50 and 100-week SMAs that seem to have formed stiff resistance at around $1,800. Once XAU/USD stabilizes above those SMAs, it will need to flip $1,820 (Fibonacci 50% retracement of the March-November downtrend) into support in order to preserve its bullish momentum. Above that hurdle, $1,860 (Fibonacci 61.8% retracement) and $1,900 (static level, psychological level) could be seen as targets before XAU/USD finally aims for $2,000.
On the downside, $1,780 (Fibonacci 38.2% retracement) forms immediate support. If buyers fail to defend that level, additional losses toward $1,730 (Fibonacci 23.6% retracement, 20-week SMA) and $1,700 (200-week SMA) could be witnessed. A weekly close below $1,700 could be seen as a significant bearish development and open the door for an extended slide toward $1,640 (end-point of the downtrend) and $1,600 (static level, psychological level).
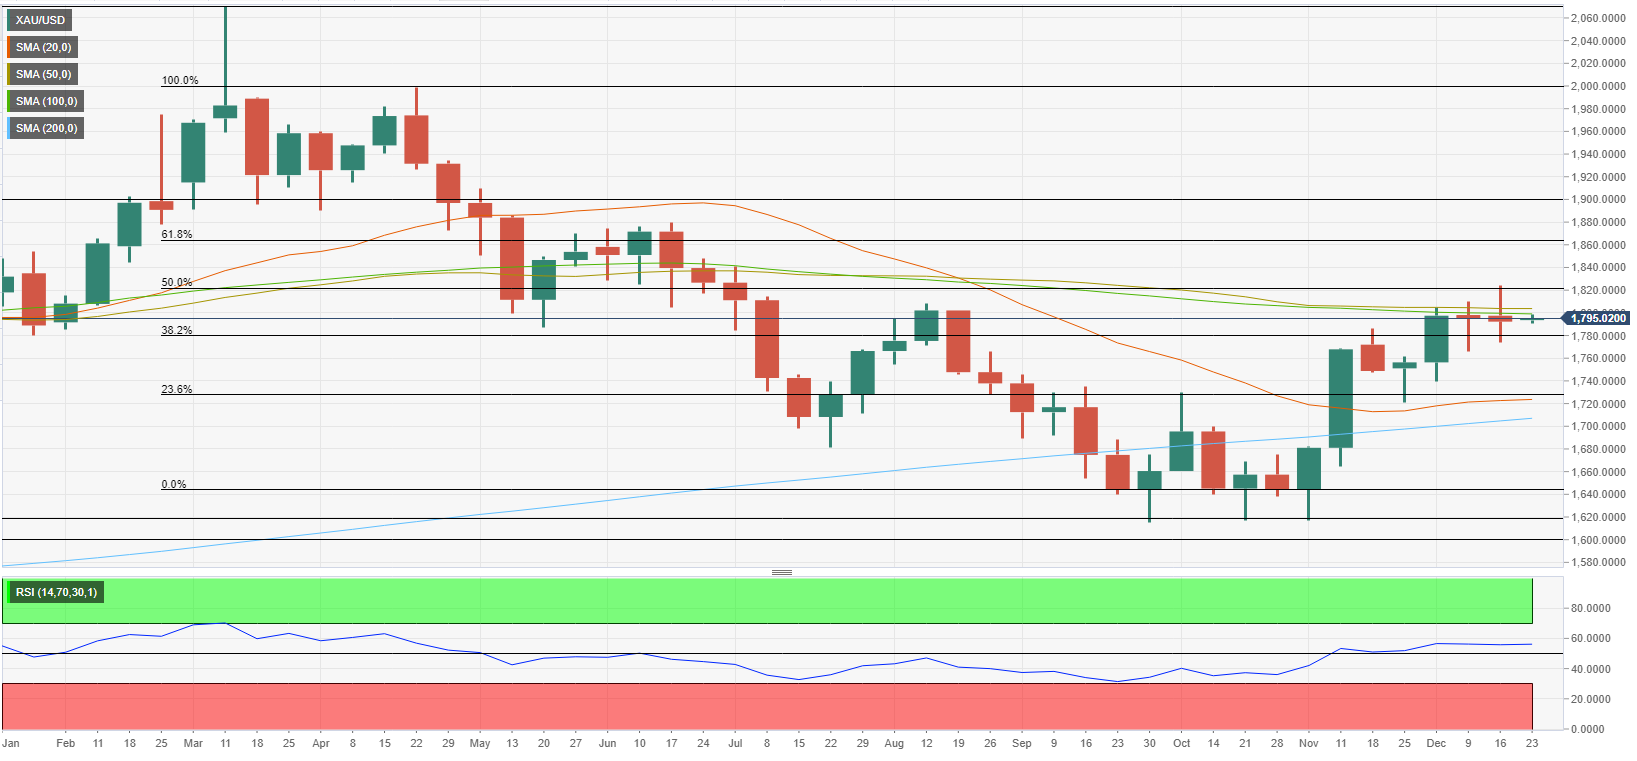
XAU/USD weekly chart
Premium
You have reached your limit of 3 free articles for this month.
Start your subscription and get access to all our original articles.
Author

Eren Sengezer
FXStreet
As an economist at heart, Eren Sengezer specializes in the assessment of the short-term and long-term impacts of macroeconomic data, central bank policies and political developments on financial assets.


