Gold Weekly Forecast: Lots of key events leading into next week could help the rally continue
- Gold is only USD 20 per troy ounce away from hitting all-time highs.
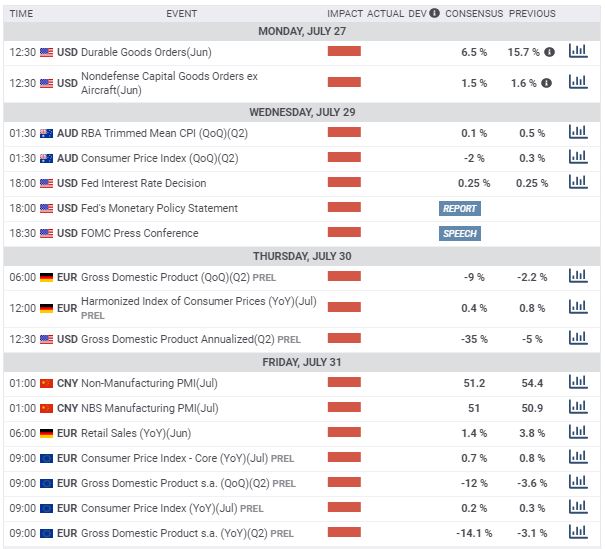
- Next week we see if the US government approves a new stimulus bill.
- We hear the latest from the Federal Reserve and see if the China-US war of words escalates.

Gold is going parabolic
With a record amount of central and government stimulus flooding the markets, gold is now within touching distance of the record high. QE was first adopted after the 2008 financial crisis and it seems the financial markets have been addicted to liquidity ever since. The debt to GDP ratios of the major nations have increased dramatically and it's leaving many economists to wonder if it will ever end.
The Fed's balance sheet could reach USD 10 trillion by the end of next year. It seems that whenever the stock markets are in trouble a new story hits the newswires announcing an expansion of their holdings or a new innovative product which will help ease the woes. Central banks are now directly buying company debt and just yesterday the Fed announced another product that can be excepted by the program. Adding to this the RBNZ are even looking at holding overseas assets on its balance sheet.
In addition to this, the main interest rates at the worlds major central banks are close to zero if not in minus numbers. Some central banks who are not yet in negative territory (BoE and RBNZ) are starting to consider joining the ECB, SNB and BoJ.
What does all this mean for gold?. Gold is often used as the ultimate safe haven. It is also an inflation hedge and it is negatively correlated to the US dollar. All of this is the perfect mix for the yellow metal to hit its all-time high. If more and more money is printed, it makes the value fall. The dollar has been dropping dramatically and this is due to the counties handling of the coronavirus and QE.
Next week
The main event on the calendar next week is the Fed rate decision, statement and press conference. There not be any real desire to sound too hawkish as the US could be moving into lockdown again. Some of the recent data has improved but this will largely be ignored. The Fed will not want to speak about the recent pullback in the stock markets but in historical terms whenever there has been a sustained fall the Fed has always acted.
China and US are at each other's throats at the moment and next week this saga will be in focus once again. The tit for tat embassy closures have been unfortunate for the stock market bulls and the war of words between the nation's officials bout intellectual property theft and sanctions on government officials could escalate.
Newswires have been reporting that there could be a resolution to the fiscal stimulus measure on Monday. The amount has now fallen to USD 600 billion from in the trillions. Looking at what the EU recovery fund did to the EUR maybe the US government officials will take some inspiration from that meeting.
Gold monthly chart
As you can see from the monthly chart below the price is a stones throw away from the all-time high of USD 1920.94 per troy ounce. There is not much to analyse from a technical standpoint other than potential targets. If the price does pull away from the highs the consolidation high at the red line near USD 1800 per ounce could be a good support. Beyond that, the blue line at USD 1525 per ounce is next in line to support any price fall. For now though the whole market is waiting for a break of the high.
-637312119785416813.png)
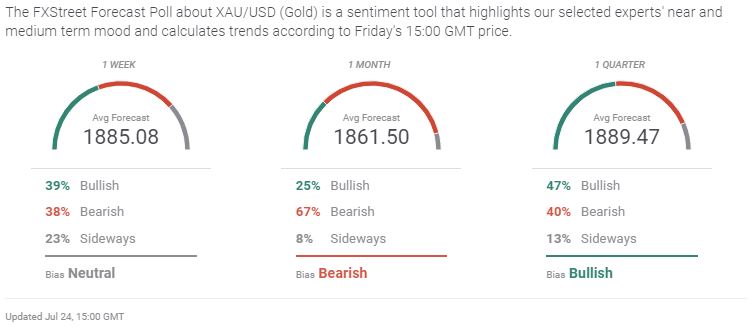
Market sentiment
According to the lastest FXStreet poll, the readers seem bearish. The market is about to break the all-time high and the quarter average forecast puts expectations at USD 1889.47 per troy ounce. The one-month outlook is even worse!.
Additional links
Old article highlighting the forecast for higher levels (https://www.fxstreet.com/analysis/gold-price-analysis-a-huge-level-has-been-broken-and-now-traders-are-looking-at-higher-targets-202005151640)
Premium
You have reached your limit of 3 free articles for this month.
Start your subscription and get access to all our original articles.
Author

Rajan Dhall, MSTA
FX Daily
Rajan Dhall is an experienced market analyst, who has been trading professionally since 2007 managing various funds producing exceptional returns.


