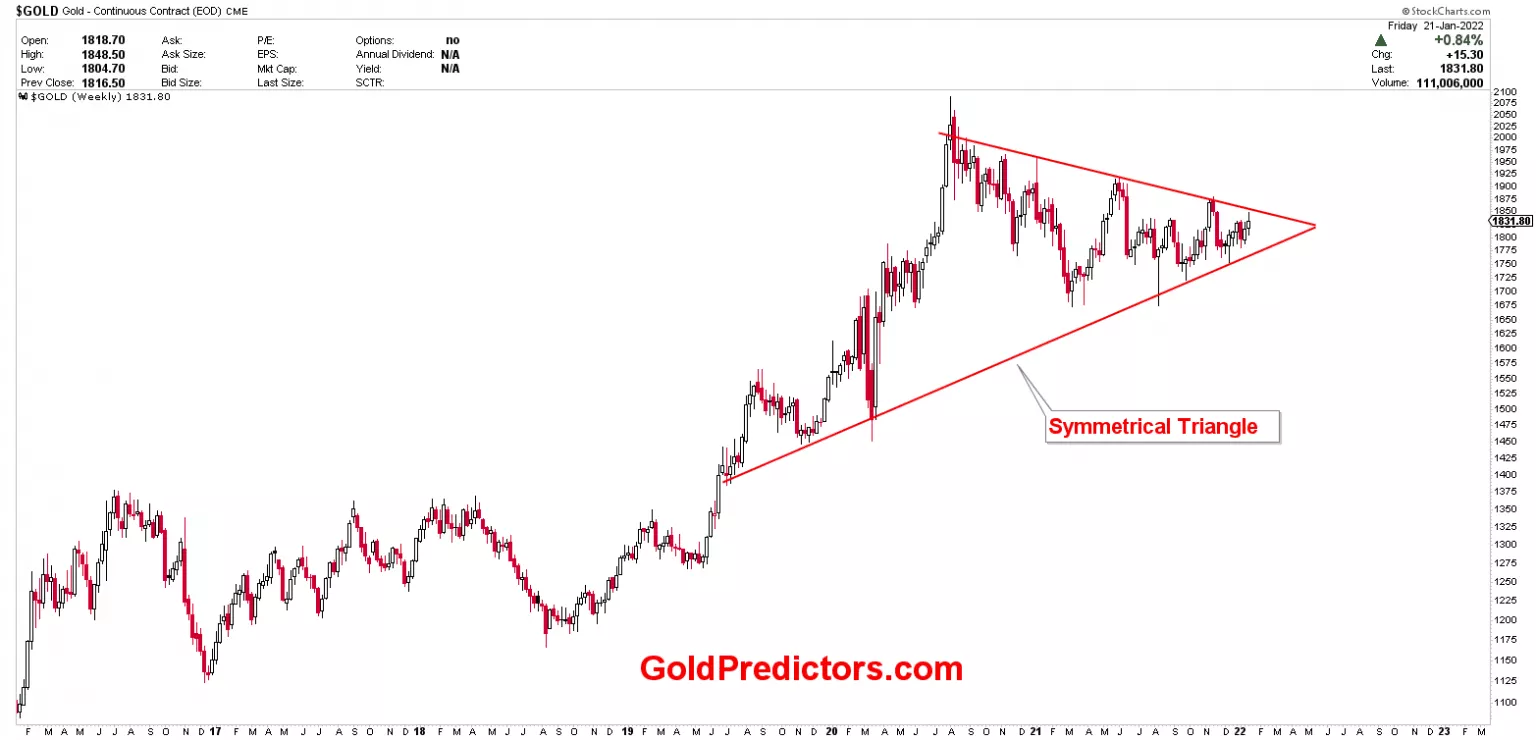
Gold drops from symmetrical triangle

The FOMC prepared the tone for an interest rate hike in March, delivering an aggressive signal. Gold fell hard from the strong technical resistance zone. The FOMC released its latest monetary policy statement, confirming its hawkish stance. First and foremost, the Fed acknowledged that it would begin raising interest rates soon.
Asymmetrical triangle is a chart pattern that consists of two converging trend lines that connect a series of sequential peaks and troughs. A rising wedge, falling wedge, ascending triangle, or descending triangle is a trend line that converges at unequal slopes. Some analysts believe that this is a neutral pattern, and that any breakout from this triangle indicates the next move in prices. We expected a drop from the triangle this time because gold has been muted for a long time and medium-term cycles don’t indicate a breakout in January 2022.
Gold dropped hard from the strong technical resistance of $1,850 as discussed in weekly letter this Monday. The idea to sell gold at $1,838 was good. Prices are now in drop mode and we still expect further downside. We have not been satisfied with the latest rally in gold in January and therefore a clear warning was issued to members to realize the importance of symmetrical triangle at $1,850 regions. The first support level from $1,850 is $1,800, where gold will attempt to initiate its first bounce.
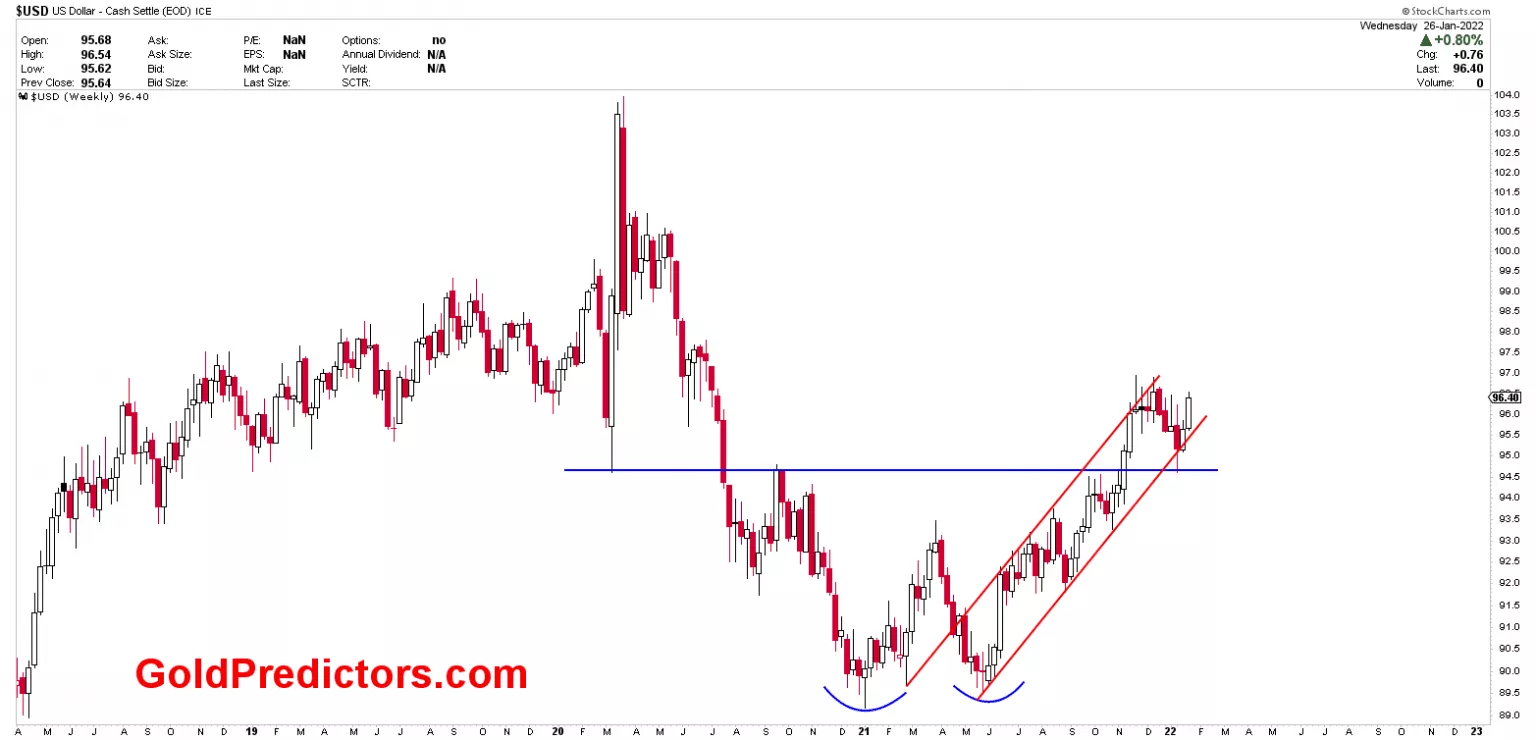
Another reason for gold’s decline was the US dollar index’s strong support level at the blue horizontal line. Last week, we referred to the blue support line as an inflection point, stating unequivocally that any breakdown from this line would trigger the next long-term drop in the US dollar index. Since medium-term cycles indicate a drop in gold prices, a rally in the US dollar index caused the gold to fall from triangle’s strong resistance. We expected $1,675-$1,680 to be the lows of 2021 in March 2021. The lows for year 2021 in gold was $1,674.
Unlock exclusive gold and silver trading signals and updates that most investors don’t see. Join our free newsletter now!
Author

Muhammad Umair, PhD
Gold Predictors
Muhammad Umair is a financial markets analyst and investor who focuses on the forex and precious metals markets.


