Gold demand trend Q1 2021

According to a report from the World Gold Council (WGC), gold demand for Q1 2021 (excluding OTC) amounted to 815.7t, almost equivalent to Q4 2020, only down 23% compared to Q1 2020. Meanwhile, the average gold price in the first quarter was 13% higher y/y, but it fell 4% q/q. The low price relative to last year’s high has increased consumer demand as activity after the economic opening and the ongoing recovery lifted sentiment.
Jewellery demand was 477.4t, up 52% y/y. The value of jewellery spending – US $27.5 billion – was the highest for the first quarter since Q1 2013. Investment in bars and coins of 339.5t (+ 36% y/y) was supported by bargain-hunting, as well as expectations of building inflationary pressure. Consumer demand growth was offset by strong outflows from the gold backed ETF (gold ETF), which lost 177.9 in Q1 as higher interest rates and the downward trend in prices weighed on investor sentiment.
Q1 indicates a healthy level of net buying by central banks, while global official gold reserves grew by 95.5t, 23% lower y/y, but 20% higher on a q/q basis. Gold used in technology grew 11% y/y in Q1 as consumer confidence continued to recover. Demand at 81.2t was slightly above the five-year quarterly average of 80.9t.
Last week the China Gold Association reported that China’s gold consumption in the first quarter rose 93.9% from the same period the previous year to 288.2t. China, the world’s largest gold consumer, saw consumer demand in the first quarter of 2021 rise to 286.4t from the previous quarter.
The surge in demand for gold is supported by factors of improving economic conditions, lower gold prices, and the massive sale related to holidays. China’s March net gold imports through Hong Kong surged to the highest level since December 2019 after new import quotas were issued by the central bank due to increased demand.
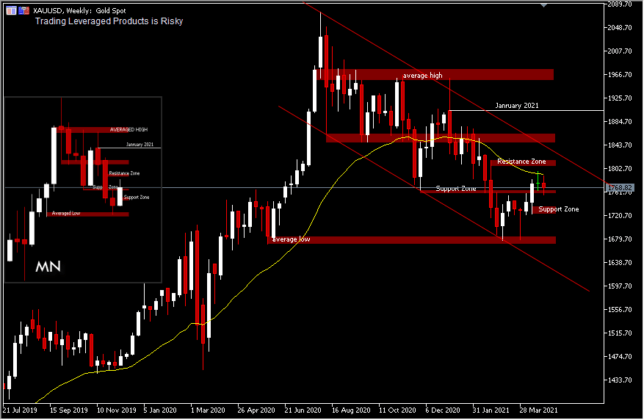
Last week, gold was trading down by -0.45%. It is still moving in a corrective wave since the peak of 2075.08 August 2020 was formed. Prices are still trading below the 26 week (1/2 year) moving average. This asset takes the average price to around 1675.00-1690.00, on the range seen at the peak of the decline that occurred when the COVID-19 virus spread to the mainland of the Blue Continent in March last year. Rising bond yields and increased risk appetite hurt XAUUSD prices. The benchmark 10-year yield rose to a more than 2-week high after a trillion-dollar proposal in spending and new data showing US economic growth in the first quarter.
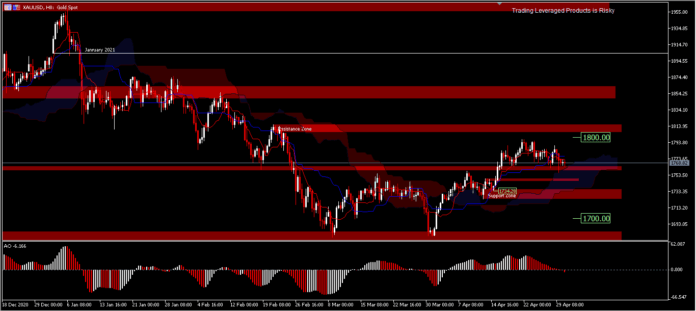
XAU/USD, H8
Intraday the short-term uptrend is under pressure; if the price cannot move above 1,800.00 then the price could remain flattened. A break below the 1,756.00 minor support level will erase any hopes of a rally, as the price could retest the 1,730.00 price range. A rebound of 1,678.00 forming a double bottom could finish this scenario, if there is no further rally movement above 1,800.00. As long as the minor support remains intact, the projection for the price will first consolidate below 1,800.00.
According to the CFTC report for the week ended April 27, Net Length gold futures slumped -10,879 contracts to 170,617, while Net Length silver futures increased +1,160 contracts to 42,841. For PGM, Net Long Nymex platinum futures added +3,611 contracts to 29,296, while those for palladium added +309 contracts to 3,004.


