Gold behavior after the bounce

Gold prices formed a bottom at the key inflection point of $1,680 and began to rise towards the $1,800 region. The previous week was designated as the “Wait and Watch” week. As per expectations, prices settled in the $1,795-$1,775 range throughout the week. As we discussed last week, $1,790-$1,810 is the first resistance of this bounce from the inflection point. Gold prices have so far stalled at $1,795. This is a short discussion on the gold behavior after the bounce from the inflection of $1,680.
The gold behavior
The chart below depicts the formation of an ascending broadening wedge followed by the formation of a descending broadening wedge. According to the fundamentals of these patterns, the ascending broadening wedge is a bearish price pattern with an 80% probability. On other hands, the descending broadening wedge is a bullish price pattern with an 80% probability. Considering the most recent bull phase in gold, began in 2019, $1,680 is referred to as the Key Inflection point. The significant flux must enter the market at this inflection point. Prices remains bullish as long as $1,680 holds.
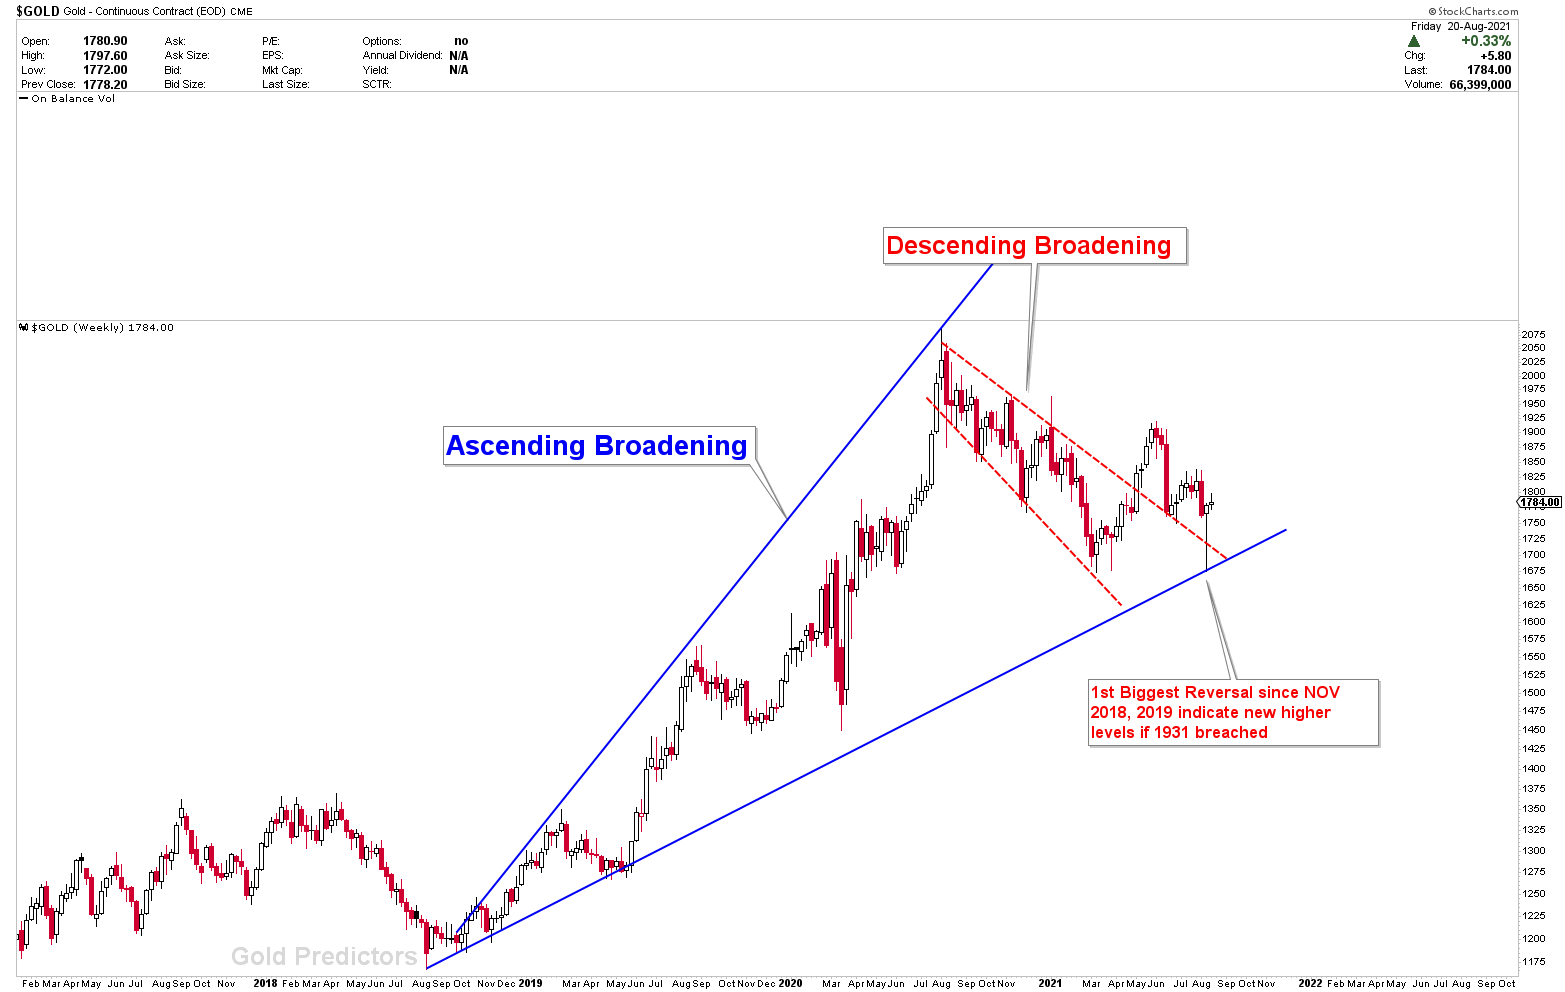
Looking at the chart above, the inflection point also coincides with the breakout of the descending triangle. A re-test followed by a sharp reversal above the descending triangle indicates the presence of bullish forces. While the first resistance was met in the $1,790-$1,810 region, it is likely that the subsequent drop through $1,765 will initiate the second move. We will go into great detail in the premium article to discuss the next move in the markets.
Zoom in the inflection point
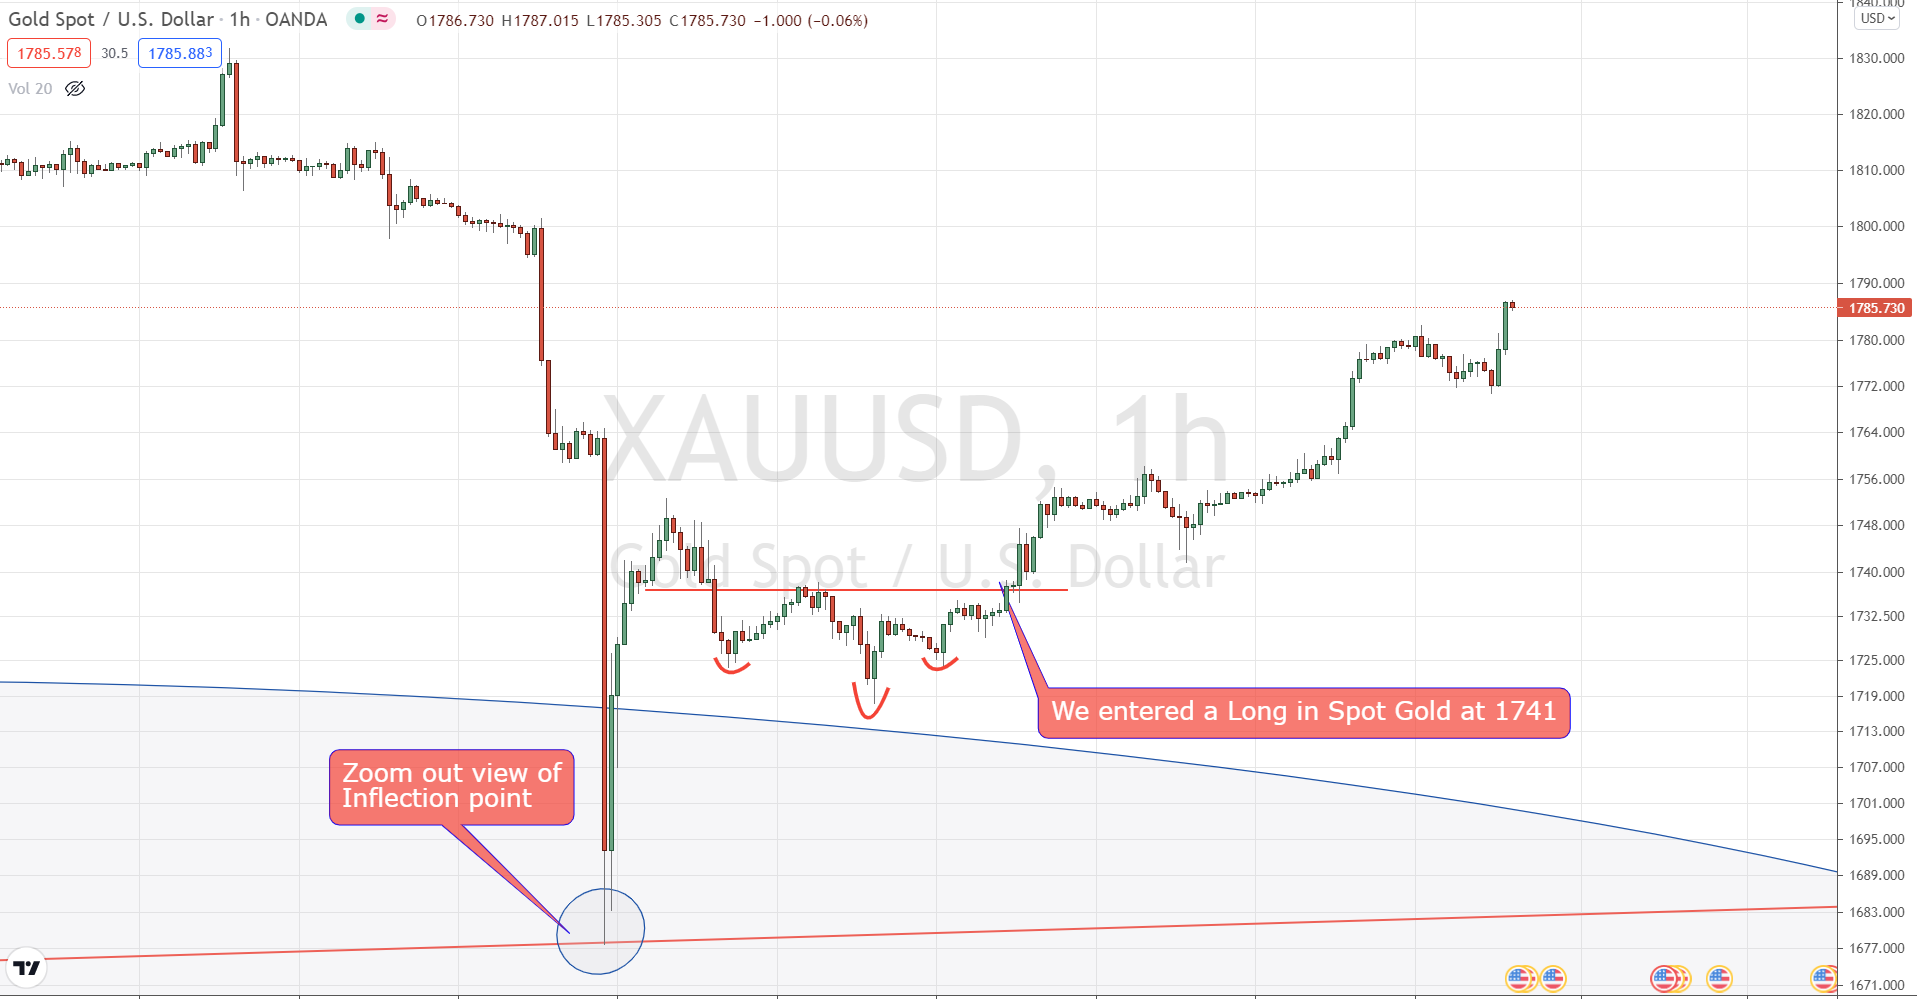
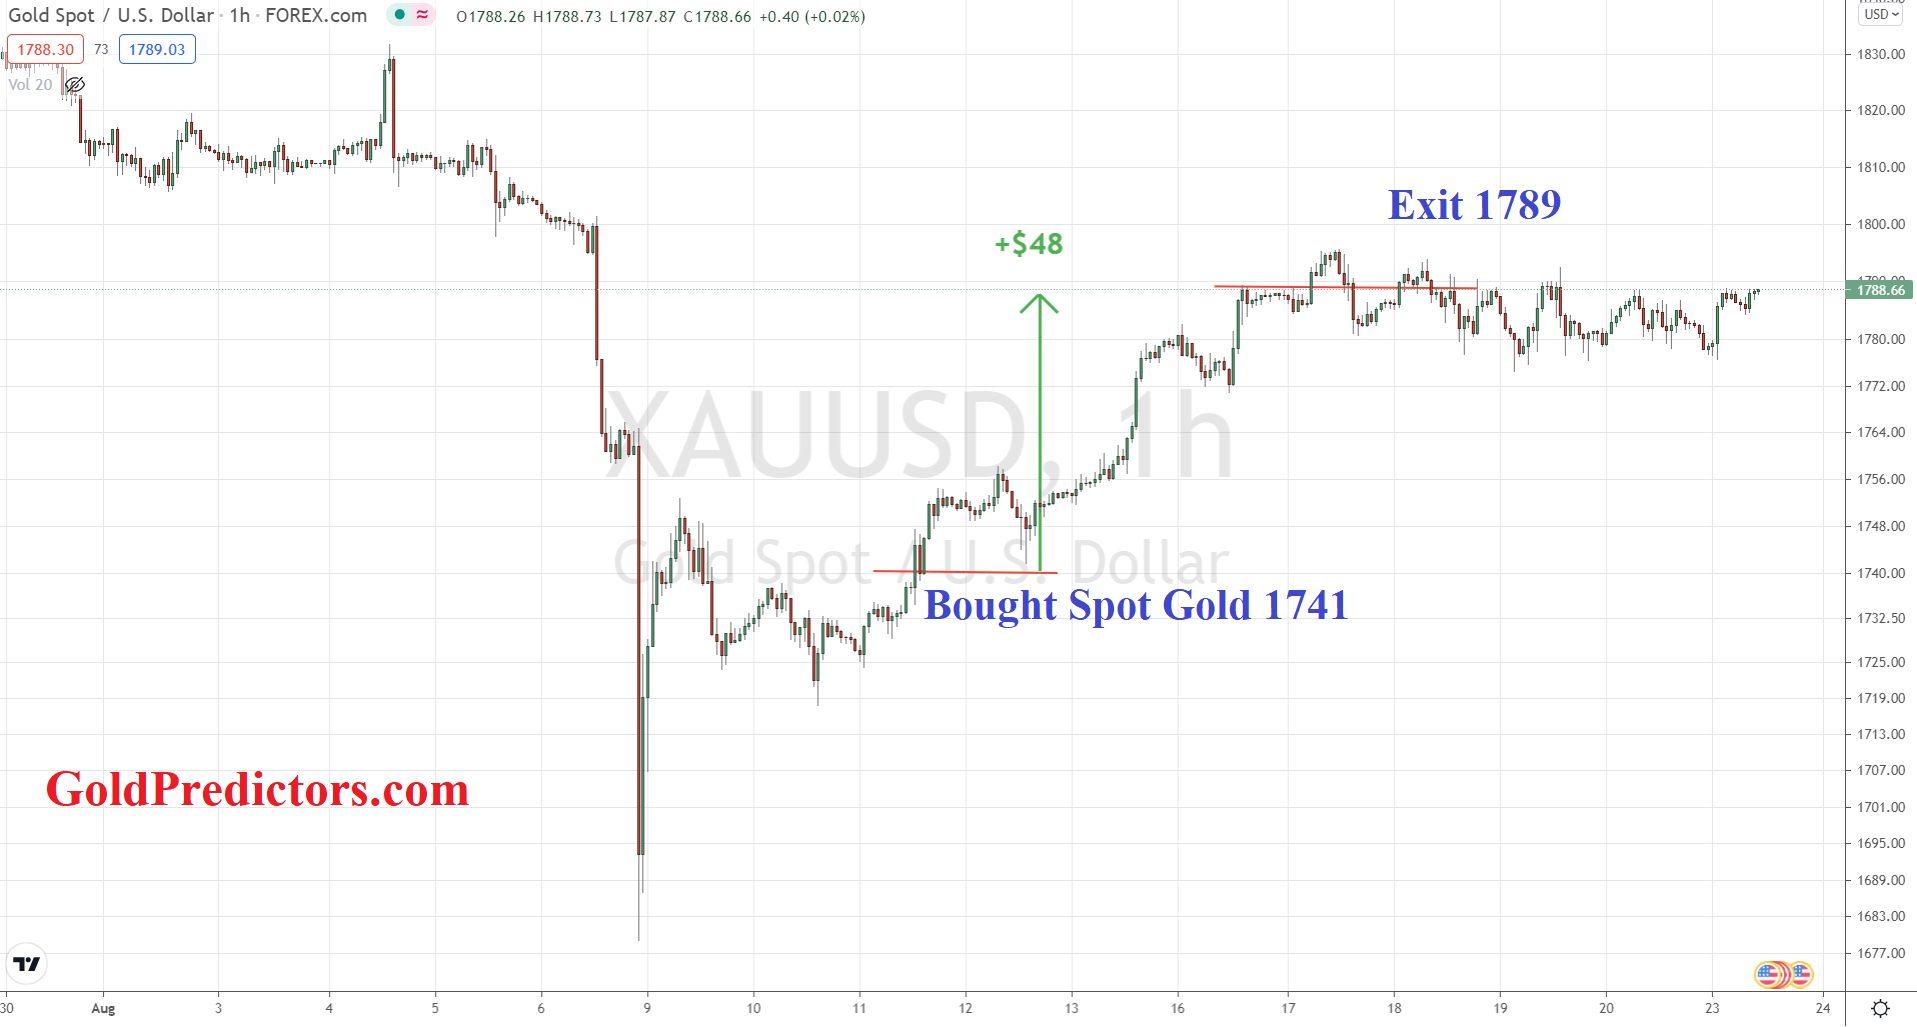
The chart was discussed in the premium section. The zoom in view reveals that the drop to $1,680 occurred in a matter of minutes. A quick reversal above this inflection indicates that prices are moving to the first resistance, which has already been reached. We executed a Long Trade for premium members at $1,741 and closed it at $1,789 last week, profiting $48.
How to trade gold volatility?
Due to the high volatility and large swings in gold and silver prices, trading in these metals has become quite risky. As previously discussed, the sideways range of $1,700-$1,900 has created a lot of uncertainty in gold markets. Due to this uncertainty markets are likely to show some risk. Our most recent trade was to enter the Spot gold at $1,741 when prices produced the inverted head and shoulders pattern, confirming a very short-term bottom at $1,741. Prices skyrocketed after we entered the market, reaching 1795. We exited the trade at 1789, making a $48 profit.
This week is a little tricky for gold and silver traders. In silver, our major level of 23.01 has been tested several times, and the next move is likely to begin. We’ll be look at gold and silver trades and will be executed in the premium section.
Unlock exclusive gold and silver trading signals and updates that most investors don’t see. Join our free newsletter now!
Author

Muhammad Umair, PhD
Gold Predictors
Muhammad Umair is a financial markets analyst and investor who focuses on the forex and precious metals markets.


