Briefly: In our opinion no speculative positions are currently justified from the risk/reward perspective. Being on the long side of the precious metals market with half of the long-term investment capital seems justified from the risk/reward perspective.
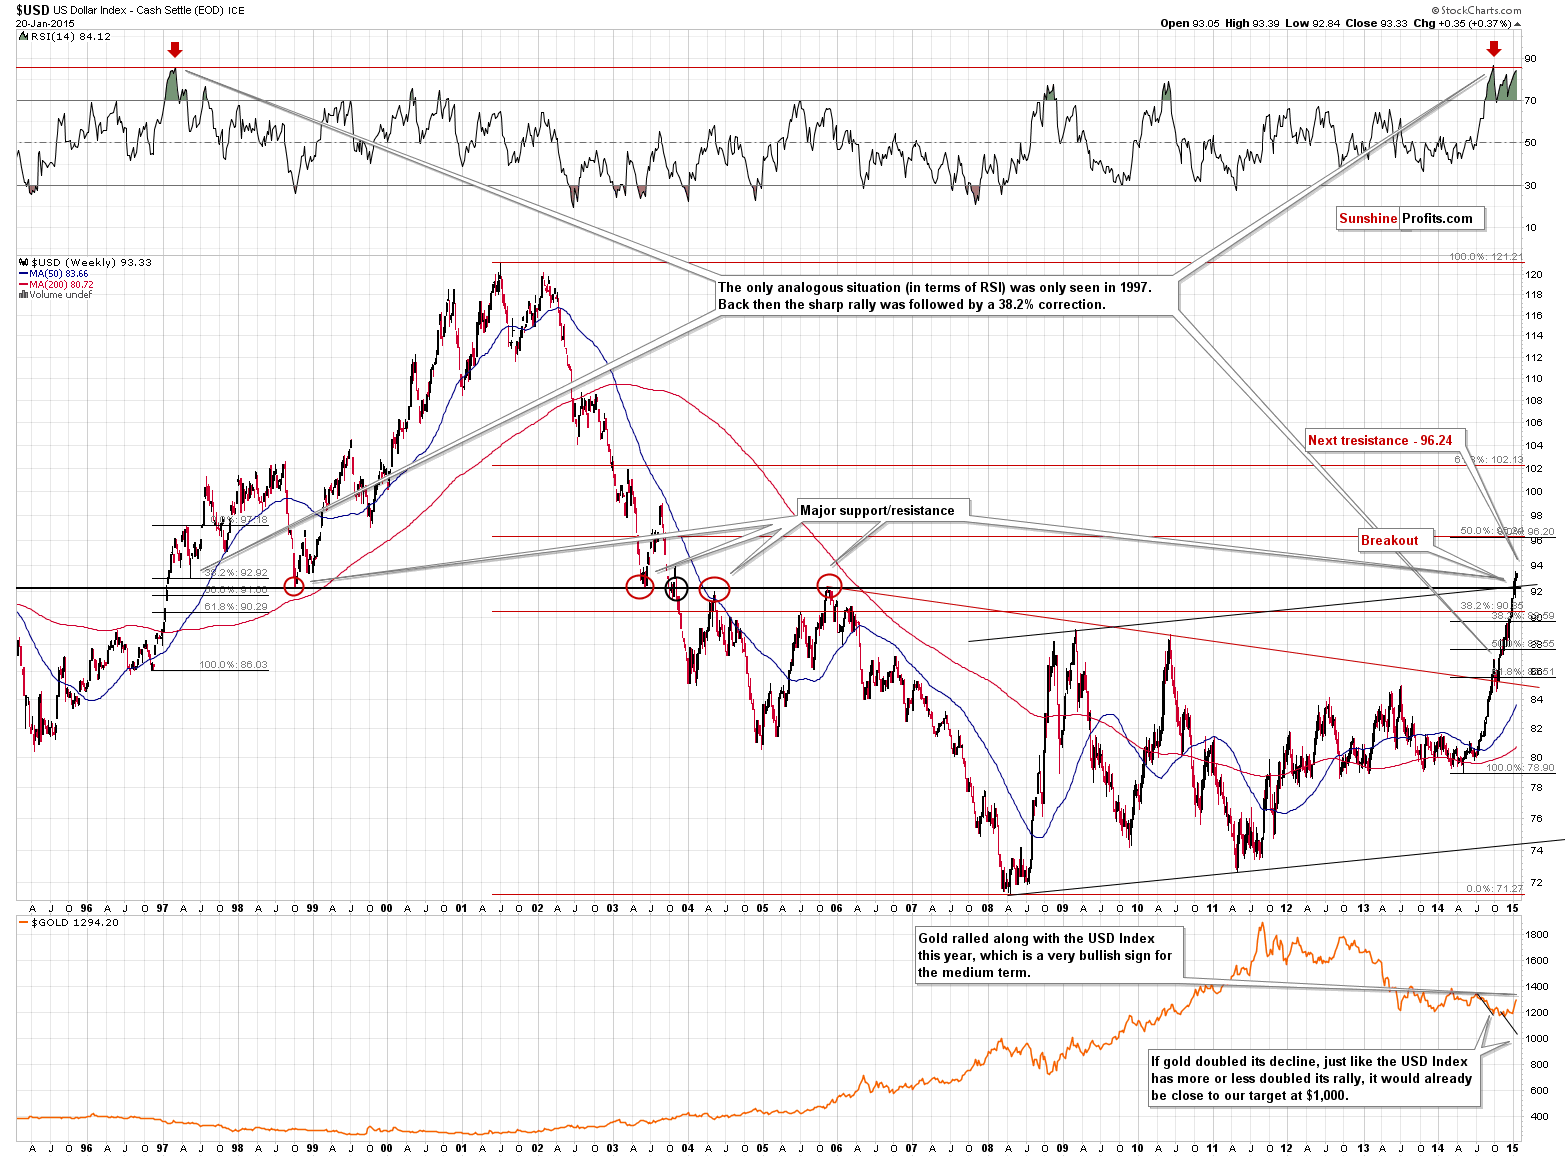
Gold rallied once again yesterday and so did silver and mining stocks. The question is if the rally is about to pause or end, since mining stocks are not really outperforming gold and the USD Index has just confirmed the breakout above the 2005 high.
The rally in gold looks encouraging, but let’s keep in mind that no market can move in the same direction without temporary corrections. What changed yesterday? The HUI Index moved to its major resistance. We’ll cover that later today. Let’s start with the USD Index (charts courtesy of http://stockcharts.com).
The breakout above the 2005 high has just been verified, by both a weekly close, and 3 consecutive daily closes above this level. The outlook is bullish once again. The next resistance is slightly above the 96 level, and it’s quite likely that the USD Index will move to these levels – unless the news from the ECB will cause the moves to reverse. That seems unlikely at this time, though, precisely because of the breakout’s confirmation.
On Monday we wrote the following:
The above has bearish implications for the gold market, however, given gold’s recent ability to rally along with the USD, we could expect the bearish implications to be delayed.
They were indeed delayed. Gold managed to move even higher in the past several days.
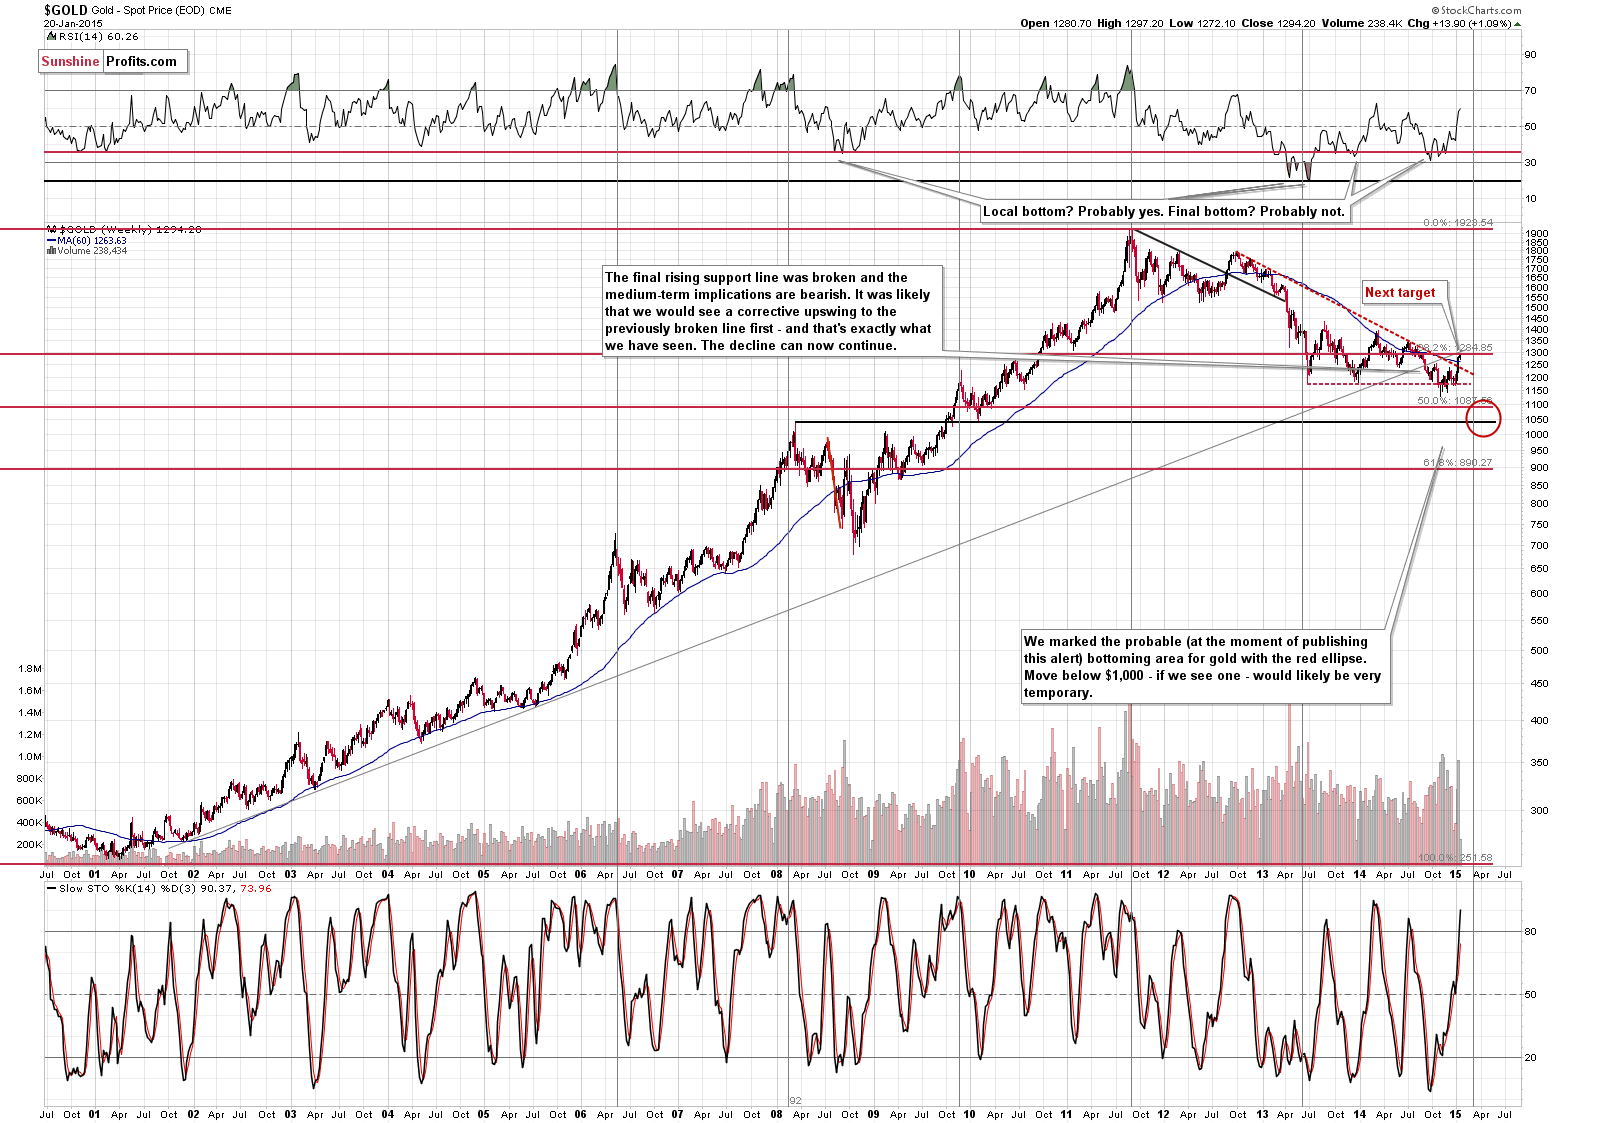
On Monday we emphasized that the next significant resistance was at about $1,300, which was not only a psychologically important number (being a round one) – it was also where the rising very long-term resistance line was located. Gold moved to this important resistance line and perhaps it has just formed a local top.
The following comments remain up-to-date also today:
Please note that the long-term cyclical turning point is very close. The previous turning point was due in mid-2013 and the major bottom materialized several weeks after that point. Perhaps it will be the case once again, which means that we could see a bottom after April or so. It’s not a very strong bearish factor, but we’d say it’s something worth keeping in mind – especially given the breaking-out USD Index.
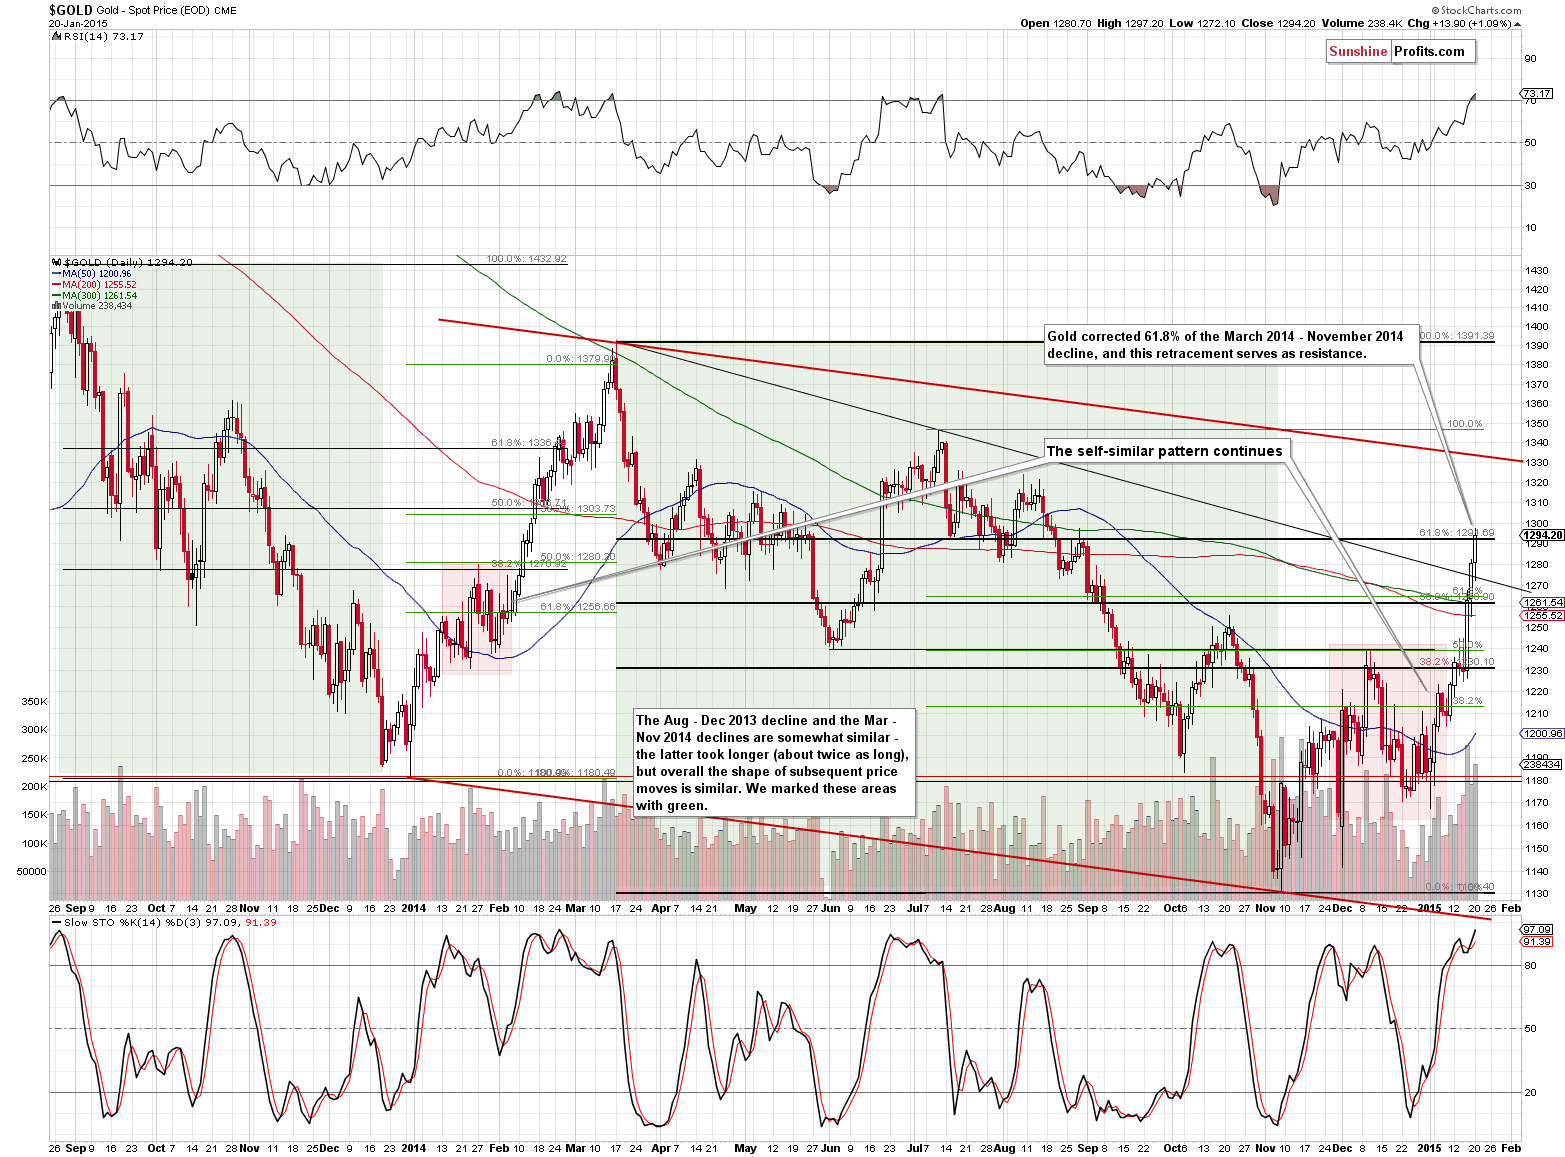
From the short-term perspective, gold moved to the 61.8% Fibonacci retracement, which is another resistance line (the long-term resistance line is stronger, though).
The RSI indicator just moved above 70, which means that the rally could pause or stop shortly. In June 2013 gold kept rallying for a few more weeks, but it didn’t move much higher. We could be in this type of situation once again.
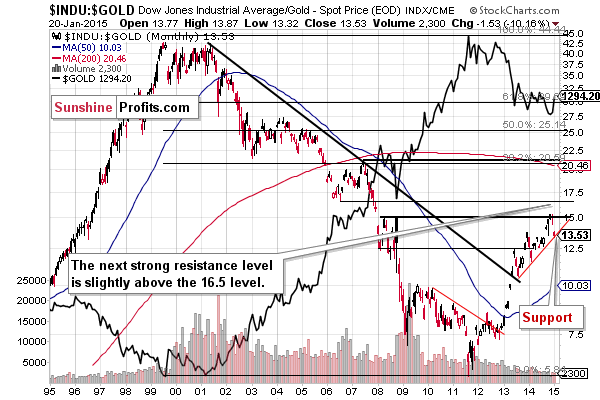
The implications of the situation in the Dow to gold ratio remain up-to-date:
Gold has indeed moved higher and the ratio has moved lower, reaching the support line. The implications are bullish for the ratio and bearish for gold.
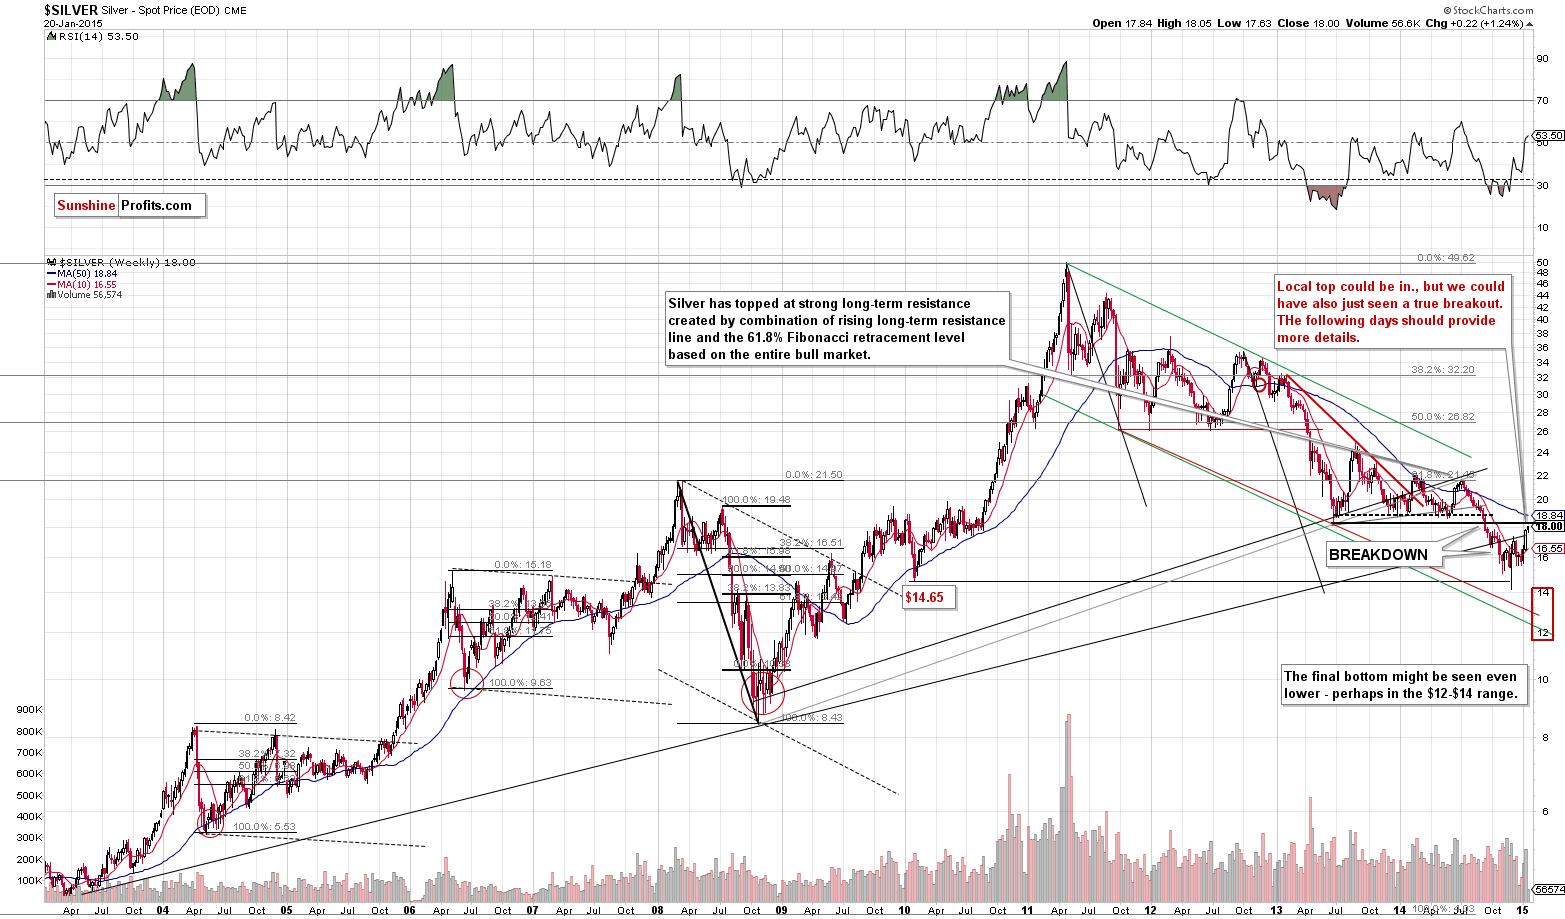
Silver moved back slightly above the very long-term, rising resistance line, which seems bullish, but let’s keep in mind that silver tends to “fake out” instead of “breaking out”. Breakouts are often signs of a looming decline, which makes us skeptical toward this “traditionally bullish” development.
Moreover, in today’s pre-market trading silver moved to its 2013 low and even moved slightly above it (the breakout was not confirmed). That’s also a very important resistance that was just reached.
In Monday’s alert we wrote the following:
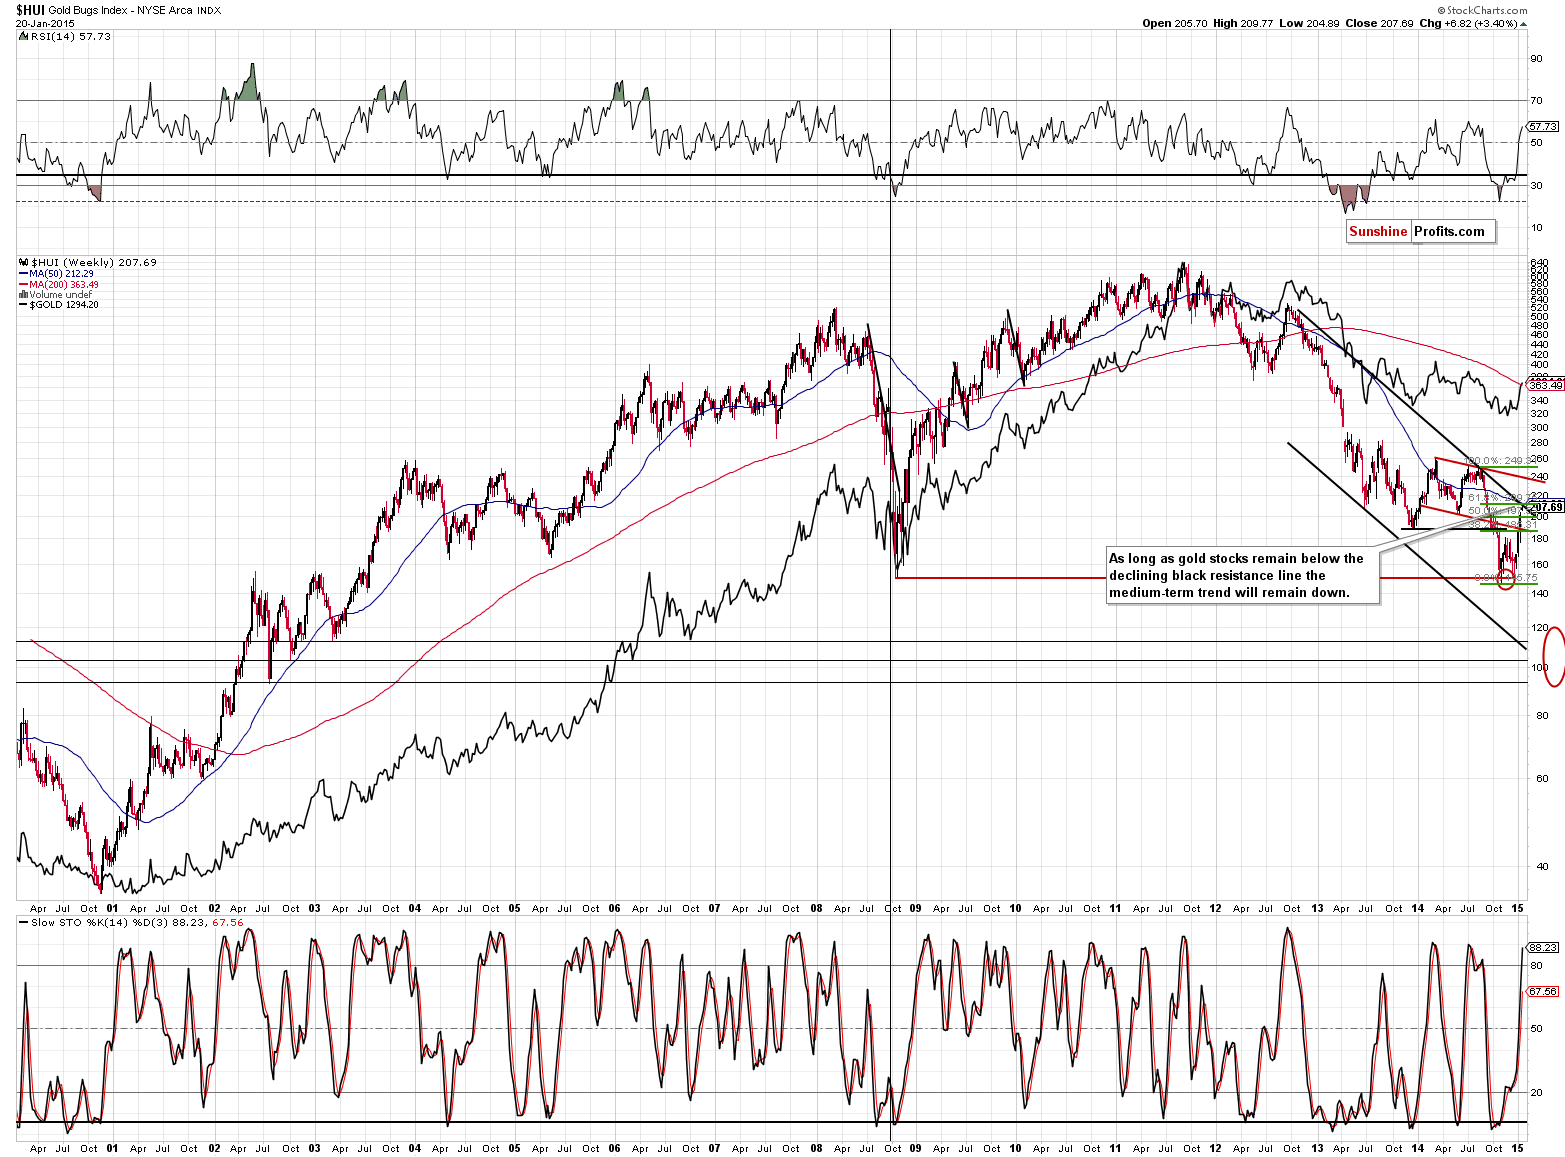
Gold stocks corrected about half of their recent decline, but the strongest resistance was not reached. The 3 important resistance levels intersect close to the 210 level: the 61.8% Fibonacci retracement, the 50-week moving average, and – most importantly – the declining long-term resistance line. If gold stocks manage to break and confirm the breakout above this level, it might serve as a confirmation that another major upswing is underway. For now, the current rally looks similar to the corrections that we saw in July 2013, in late-2013 to early-2014, and in June 2014.
This resistance (combination of resistances) was reached yesterday. The HUI Index is either about to break out or about to decline once again. Since there has been no breakout so far, the odds are that it will decline once again.
Summing up, while there are some signs that this rally might be the beginning of another major upleg in the precious metals market, it’s still more likely than not that it’s just a correction. Gold seems to be once again responding very positively to the signs from the bond market, but if the USD Index keeps rallying, the yellow metal might give up its recent gains and decline once again. Whether it declines significantly or not, it could be the case that we’re just one decline away from the final bottom before the next major rally.
Will gold, silver and mining stocks decline in the short term? That’s quite likely contrary to what one might think based on the most recent price action. However, gold stocks are at their key resistance level so if the trend is to be resumed, it has to be resumed from these levels or levels that are insignificantly higher. However, we don’t think that opening short positions at this time is a good idea just yet. The reason is that even if a decline is to follow, we could still see a volatile turnaround today or tomorrow (given the news from the European Central Bank), which could quickly close the positions given a reasonable stop-loss order. In other words, opening positions now seems too risky without stop-loss orders (in case we see a major breakout) and with them (big risk of intra-day volatility). It seems to be a better idea to wait for the initial turnaround and enter the short positions after the risk of another intra-day upswing has become smaller.
To summarize:
Trading capital (our opinion): No positions
Long-term capital (our opinion): Half positions in gold, half positions in silver, half position in platinum and half position in mining stocks.
Recommended Content
Editors’ Picks
EUR/USD eases to near 1.0700 ahead of German inflation data

EUR/USD is paring gains to near 1.0700 in the European session on Monday. The pair stays supported by a softer US Dollar, courtesy of the USD/JPY sell-off and a risk-friendly market environment. Germany's inflation data is next in focus.
USD/JPY recovers after testing 154.50 on likely Japanese intervention

USD/JPY is recovering ground after sliding to 154.50 on what seemed like a Japanese FX intervention. The Yen tumbled in early trades amid news that Japan's PM lost 3 key seats in the by-election. Focus shifts to the US employment data and the Fed decision later this week.
Gold price holds steady above $2,335, bulls seem reluctant amid reduced Fed rate cut bets

Gold price (XAU/USD) attracts some buyers near the $2,320 area and turns positive for the third successive day on Monday, albeit the intraday uptick lacks bullish conviction.
Ripple CTO shares take on ETHgate controversy, XRP holders await SEC opposition brief filing

Ripple loses all gains from the past seven days, trading at $0.50 early on Monday. XRP holders have their eyes peeled for the Securities and Exchange Commission filing of opposition brief to Ripple’s motion to strike expert testimony.
Week ahead: FOMC and jobs data in sight

May kicks off with the Federal Open Market Committee meeting and will be one to watch, scheduled to make the airwaves on Wednesday. It’s pretty much a sealed deal for a no-change decision at this week’s meeting.
