Global Indices Should Remain Resilient Despite Geopolitical Threat

Despite Beijing's objection, President Trump has gone ahead and signed two bills backing Hong Kong's protesters into law. Beijing has continuously voiced strong objection against the legislation as China sees it as meddling in its domestic affairs. Trump signed these bills as US and China still try to reach a phase one trade deal. China immediately responded by saying the bills reflect sinister intentions and hegemonic nature of the United States. The Hong Kong government also expressed strong opposition to the bills. It said it extremely regrets the U.S. repeatedly ignoring Hong Kong's concern regarding the two bills.
The first bill will require the State Department to assess annually whether Hong Kong is sufficiently autonomous to retain its special U.S trading status. Under the special status, the city is not subject to the tariffs that have been levied on China. The bills also allow the U.S. to sanction government officials the U.S. deems responsible for human rights violation in Hong Kong. The second bill will prevent the sale of tear gas and rubber bullets to Hong Kong police.
China has said it's considering a strong countermeasure. However, it's still not known what they would be doing. Hu Xijin, the editor in chief of the Chinese state-run Global Times, suggested on Twitter that China was considering barring people responsible for drafting the legislation from entering mainland China, Hong Kong, and Macau.
Several economists believe that the bills might encourage further protests and riots in Hong Kong. If the situation escalates badly, and China has to do military intervention, it will be impossible to reach trade deal. However, so far China seems to still leave the door open for a trade deal with the U.S. despite the strong complain. Both US and China have enough incentives to keep trade, Hong Kong, and political issues on separate tracks.
Now that the bills are officially signed, will it derail the risk-on rally? What does the Elliott Wave tell us about the recent development? Below we will take a look at a few major Indices:
Russell 2000 (RTY_F) Elliott Wave Chart
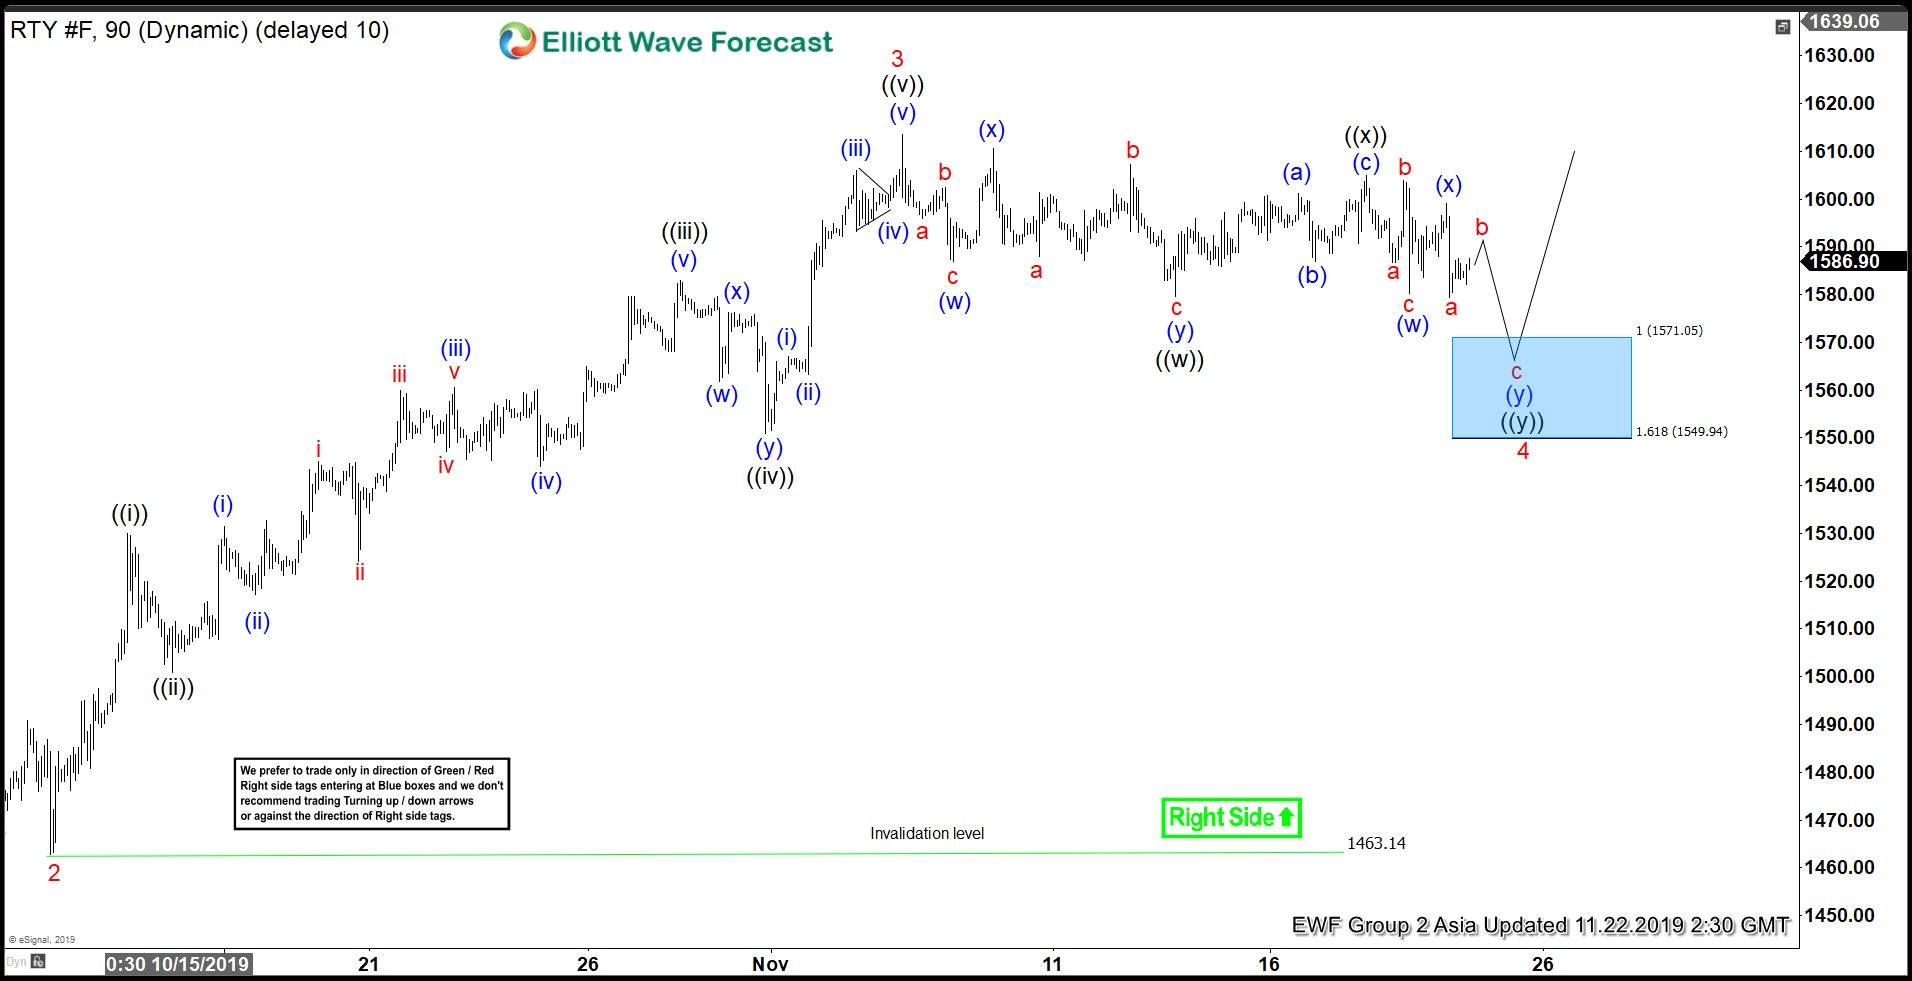
Russell 2000 (RTY_F) has recently broken above May 7, 2019 high (1621.9) opening up a bullish sequence from December 26, 2018 low. The Index now has scope to extend higher to 100% extension towards 1810.3 – 1897.1 area. Short term dips should continue to find support in 3, 7, or 11 swing as far as pivot at 1448.06 remains intact.
Nifty Elliott Wave Chart
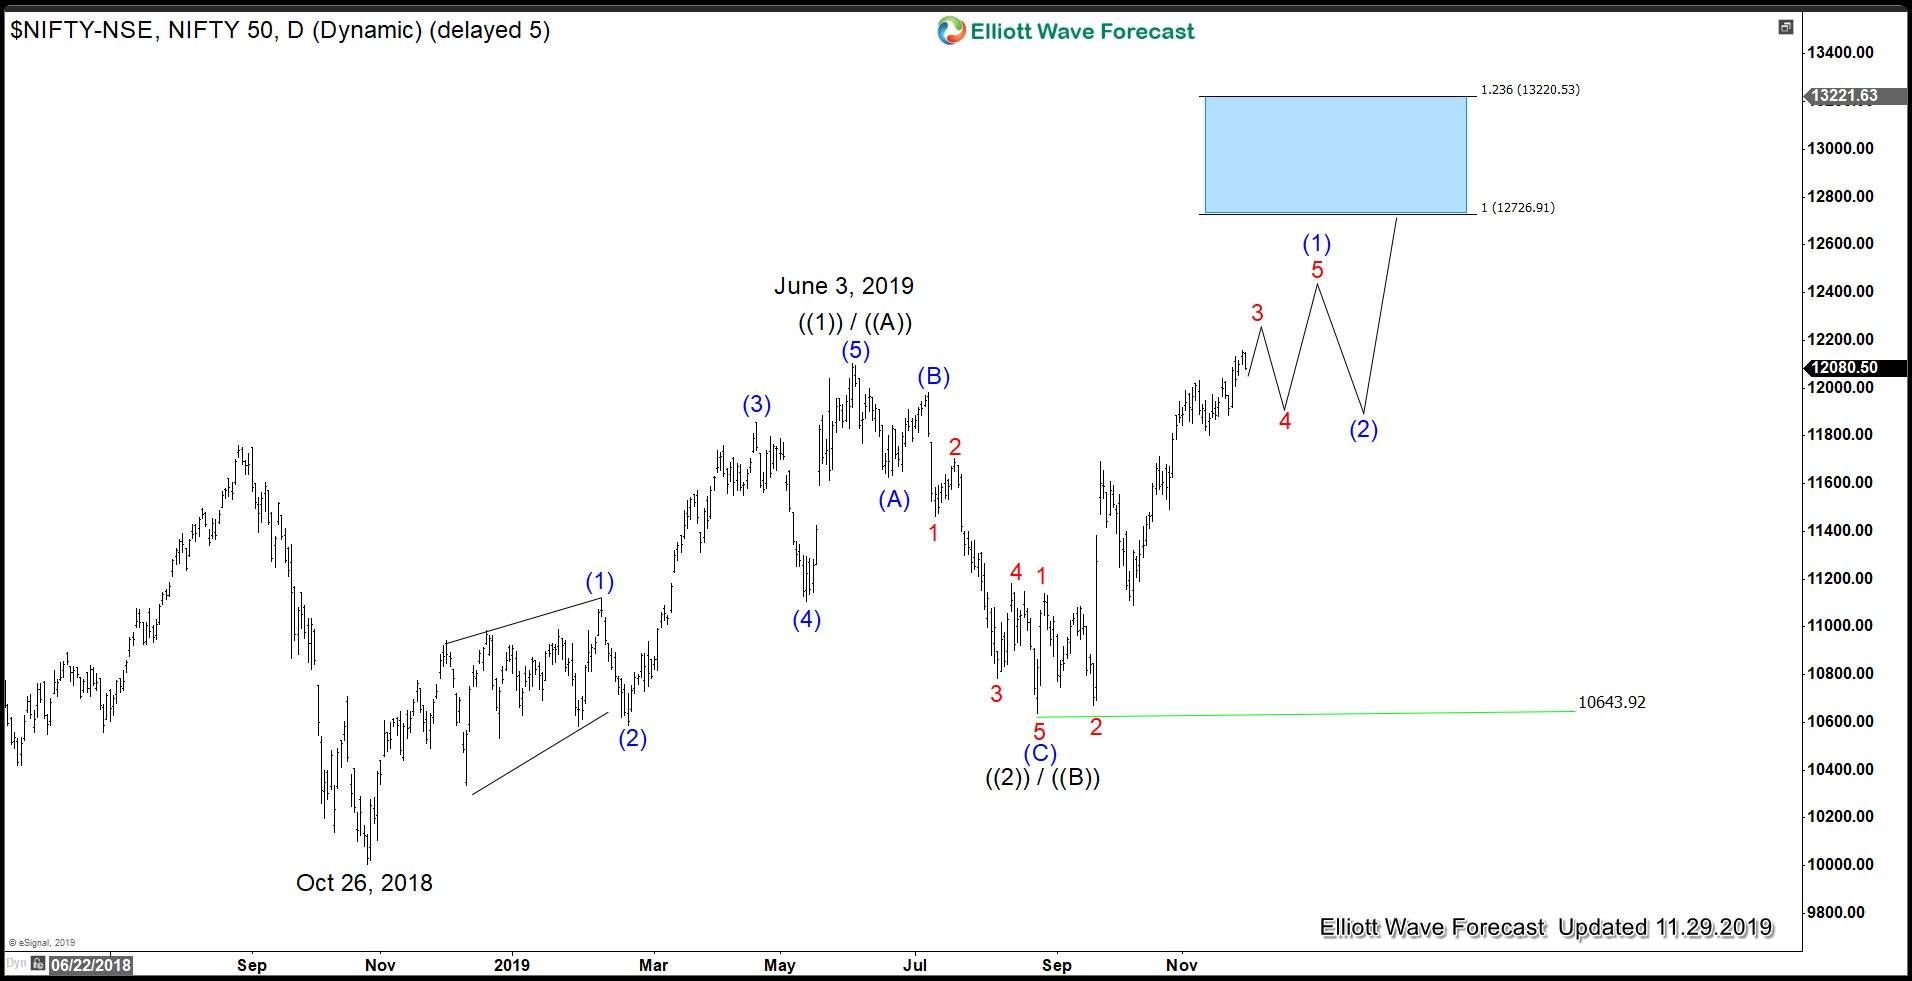
Nifty from India recently broke above June 3, 2019 high (12103.05). The break opens up a bullish sequence from October 26, 2018 low. The Index should continue to see more upside and dips likely find buyers in 3, 7, 11 swing as far as pivot at 10643.92 stays intact. The Index has a 100% minimum target towards 12726.9 – 13220.5
Based on the technical outlook, we can conclude that global Indices should remain resilient despite the geopolitical issue on Hong Kong. Indeed, despite all the harsh criticism, China still seems eager to finalize phase 1 trade deal with the U.S.
Author

Elliott Wave Forecast Team
ElliottWave-Forecast.com


