|

GBPJPY Elliott Wave Bullish Triangle Scenarios

GBPJPY Technical Analysis February 21/2017 – Triangle Idea

Traders should remain bullish as long as GBPJPY stays above the 138.51 level. Below we will show three possible Elliott Wave triangle bullish patterns. GBPJPY has bounced higher since October 2016 and the possibility of the pair continuing higher will depend if we see a breakout on any of the Elliott Wave triangle patterns below.

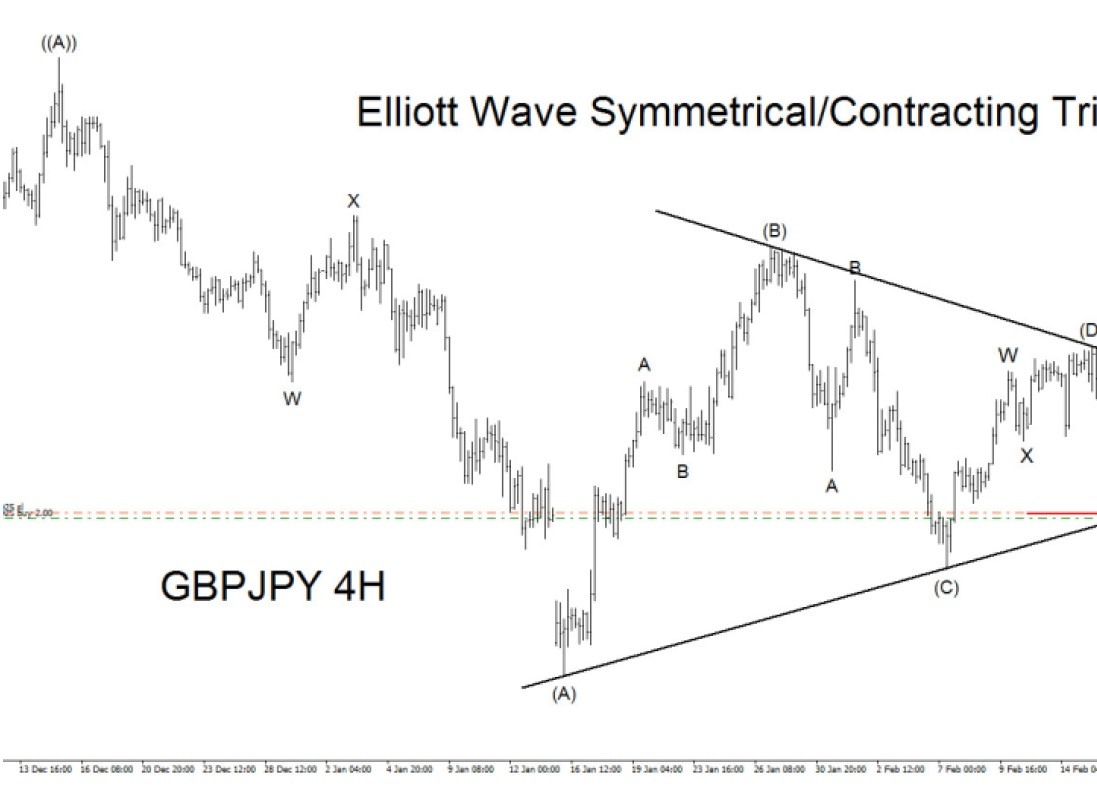
GBPJPY 4 hour Elliott Wave Bullish Symmetrical Triangle 1 : For the triangle scenario below price needs to stay above the wave ((B)) low at 139.60 and needs a break above the wave (D) high at 142.79 to add more confirmation that the wave ((B)) correction has terminated and is ready to push higher.

Elliott Wave Analysis

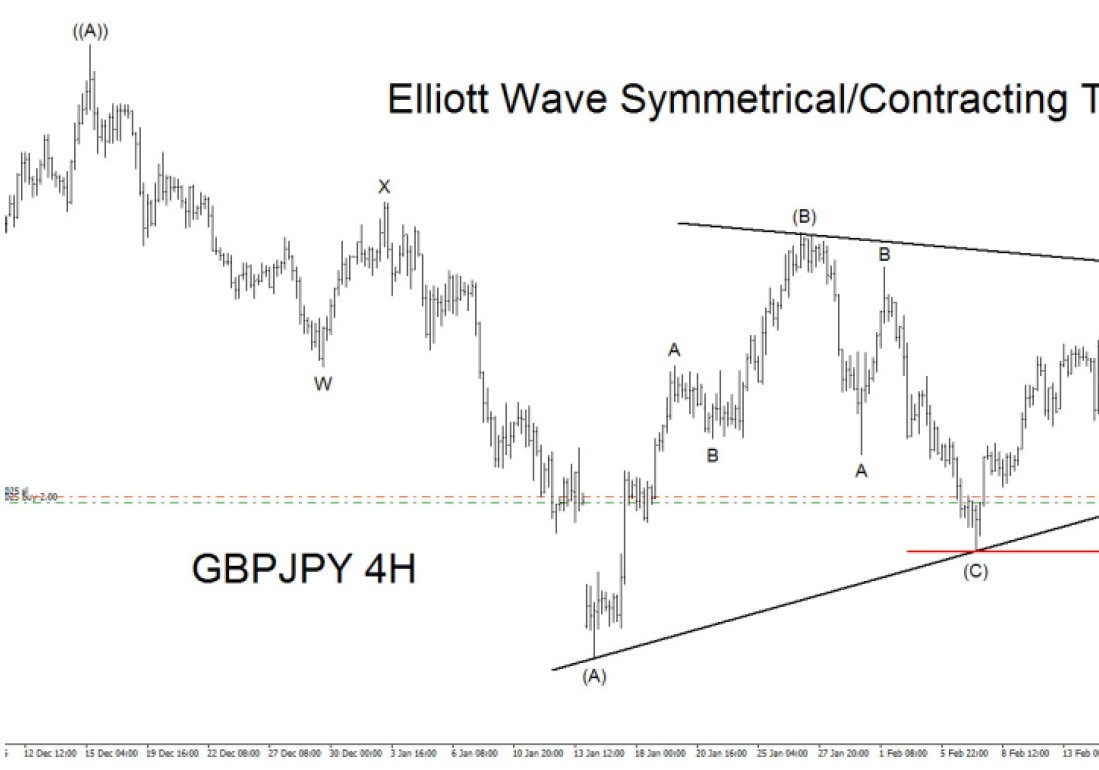
GBPJPY 4 hour Elliott Wave Bullish Symmetrical Triangle 2 : For the triangle scenario below it is still possible that wave (D) is still in progress and another push higher is still needed. For the scenario to be a triangle wave (D) needs to terminate below wave (B) then followed by a retrace lower to form wave ((B)). Traders should wait for wave (D) to terminate then look to BUY on the retrace lower of wave ((B)). Price needs to stay above wave (C) low. Below wave (C) low invalidates this scenario.

Elliott Wave Analysis

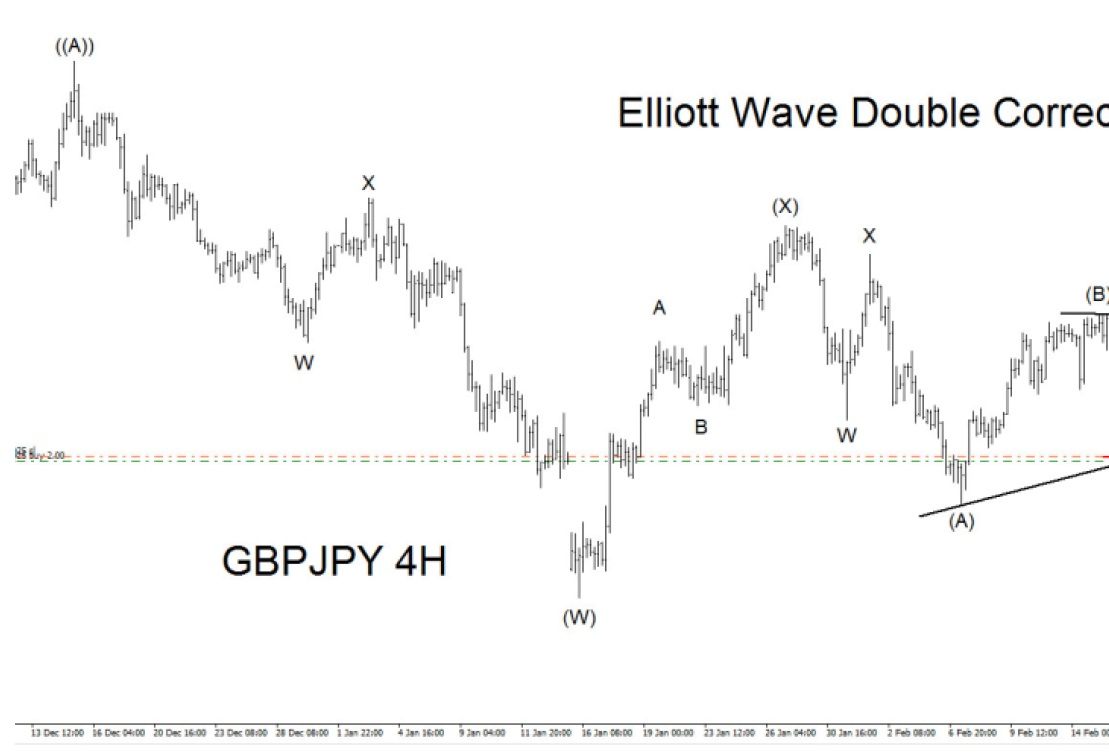
GBPJPY 4 hour Elliott Wave Bullish Double Three Triangle : The triangle pattern below is a WXY double three possible scenario. For this pattern wave (D) needs to terminate below Wave (B) then a pullback to terminate the wave ((B)) followed by price moving higher breaking the triangle formation. Traders should wait after the wave (D) has formed and BUY the wave ((B)) pullback. Price needs to stay above the wave (C) low. Below wave (C) low invalidates this scenario.

Elliott Wave Analysis

Become a Successful Trader and Master Elliott Wave like a Pro. Start your Free 14 Day Trial at - Elliott Wave Forecast.

Author

Elliott Wave Forecast Team

Elliott Wave Forecast Team

ElliottWave-Forecast.com

More from Elliott Wave Forecast Team
Share:

Editor's Picks

EUR/USD treads water around 1.1900

EUR/USD edges a tad lower around the 1.1900 area, coming under mild pressure despite the US Dollar keeps the offered stance on turnaround Tuesday. On the US data front, December Retail Sales fell short of expectations, while the ADP four week average printed at 6.5K.

GBP/USD looks weak near 1.3670

GBP/USD trades on the back foot around the 1.3670 region on Tuesday. Cable’s modest retracement also comes in tandem with the decent decline in the Greenback. Moving forward, the US NFP and CPI data in combination with key UK releases should kee the quid under scrutiny in the next few days.

Gold the battle of wills continues with bulls not ready to give up

Gold comes under marked selling pressure on Tuesday, giving back part of its recent two day advance and threatening to challenge the key $5,000 mark per troy ounce. The yellow metal’s correction follows a better tone in the risk complex, a lower Greenback and shrinking US Treasuty yields.

AI Crypto Update: BankrCoin, Pippin surge as sector market cap steadies above $12B

The Artificial Intelligence (AI) segment is largely on the back foot with major coins such as Bittensor (TAO) and Internet Computer (ICP) extending losses amid a sticky risk-off sentiment.

Dollar drops and stocks rally: The week of reckoning for US economic data

Following a sizeable move lower in US technology Stocks last week, we have witnessed a meaningful recovery unfold. The USD Index is in a concerning position; the monthly price continues to hold the south channel support.

XRP holds $1.40 amid ETF inflows and stable derivatives market

Ripple trades under pressure, with immediate support at $1.40 holding at the time of writing on Tuesday. A recovery attempt from last week’s sell-off to $1.12 stalled at $1.54 on Friday, leading to limited price action between the current support and the resistance.