GBP/USD Weekly Forecast: Pound Sterling poised for more upside in the Nonfarm Payrolls week
- The Pound Sterling briefly recaptured 1.3400 versus the US Dollar.
- GBP/USD looks to US labor data for a fresh directional impetus.
- The daily technical setup continues to favor Pound Sterling buyers.

The Pound Sterling (GBP) secured three consecutive months of gains against the US Dollar (USD) in the past week as the GBP/USD pair recaptured the 1.3400 threshold to stay at the highest level since March 2022.
Pound Sterling extended its winning streak against the US Dollar
GBP/USD entered a bullish consolidation phase between 1.3435 and 1.3250, sitting at fresh 30-month highs as the monetary policy divergence between the Bank of England (BoE) and the US Federal Reserve (Fed) continued to support the Pound Sterling at the expense of the Greenback.
Cautious remarks from the BoE policymakers contrasted with a slew of explicitly dovish commentary from Fed officials, keeping hopes for 50 basis points (bps) of interest rate cuts by the Fed alive for November. Meanwhile, markets expect the BoE to reduce rates by 25 bps in November.
Several Fed policymakers took up the rostrum and supported their decisions for a 50 bps rate cut move in September, except for Fed Governor Michelle Bowman, who stuck to her hawkish rhetoric.
Meanwhile, BoE Governor Andrew Bailey said Tuesday, “I'm very encouraged that the path of inflation is downwards. Hence, “I do think the path for interest rates will be downwards as well, but gradually.” On the other hand, BoE policymaker Megan Greene said on Wednesday that a “cautious, steady-as-she-goes approach to monetary policy easing is appropriate.”
Apart from the central bank divergence, GBP/USD drew support from persistent risk flows, as risk appetite was boosted by a flurry of stimulus measures from China, such as lowering the key Reserve Requirement Ratio (RRR) by 50 bps.
China’s Politburo, the country’s top leadership, pledged on Thursday to support the struggling economy through "forceful" interest rate cuts and adjustments to fiscal and monetary policies, stoking expectations for more stimulus.
On the economic data front, there were no top-tier releases from the UK. Therefore, traders remained glued to Friday’s core Personal Consumption Expenditures (PCE) Price Index, the Fed’s most preferred inflation gauge, for fresh hints on the size of the next interest rate cut. Markets shrugged off mixed US Jobless Claims and Durable Goods Orders data published on Thursday.
Meanwhile, the Fed’s key inflation measure moved closer to the central bank’s 2% target in August on Friday, exacerbating the USD’s pain, sending the pair back toward the 30-month highs. The headline PCE price index rose 0.1% for the month, putting the annual inflation rate at 2.2%. The core PCE Price Index increased by 2.7% YoY, as expected while the monthly core inflation ticked down to 0.1%, against the previous reading of 0.2%.
British Pound PRICE This week
The table below shows the percentage change of British Pound (GBP) against listed major currencies this week. British Pound was the strongest against the US Dollar.
| USD | EUR | GBP | JPY | CAD | AUD | NZD | CHF | |
|---|---|---|---|---|---|---|---|---|
| USD | -0.18% | -0.59% | -0.94% | -0.59% | -1.71% | -1.92% | -1.00% | |
| EUR | 0.18% | -0.46% | -0.73% | -0.40% | -1.58% | -1.73% | -0.84% | |
| GBP | 0.59% | 0.46% | -0.21% | 0.06% | -1.12% | -1.27% | -0.37% | |
| JPY | 0.94% | 0.73% | 0.21% | 0.34% | -0.86% | -0.98% | -0.18% | |
| CAD | 0.59% | 0.40% | -0.06% | -0.34% | -1.07% | -1.33% | -0.43% | |
| AUD | 1.71% | 1.58% | 1.12% | 0.86% | 1.07% | -0.13% | 0.78% | |
| NZD | 1.92% | 1.73% | 1.27% | 0.98% | 1.33% | 0.13% | 0.91% | |
| CHF | 1.00% | 0.84% | 0.37% | 0.18% | 0.43% | -0.78% | -0.91% |
The heat map shows percentage changes of major currencies against each other. The base currency is picked from the left column, while the quote currency is picked from the top row. For example, if you pick the British Pound from the left column and move along the horizontal line to the US Dollar, the percentage change displayed in the box will represent GBP (base)/USD (quote).
US employment data to dominate the week ahead
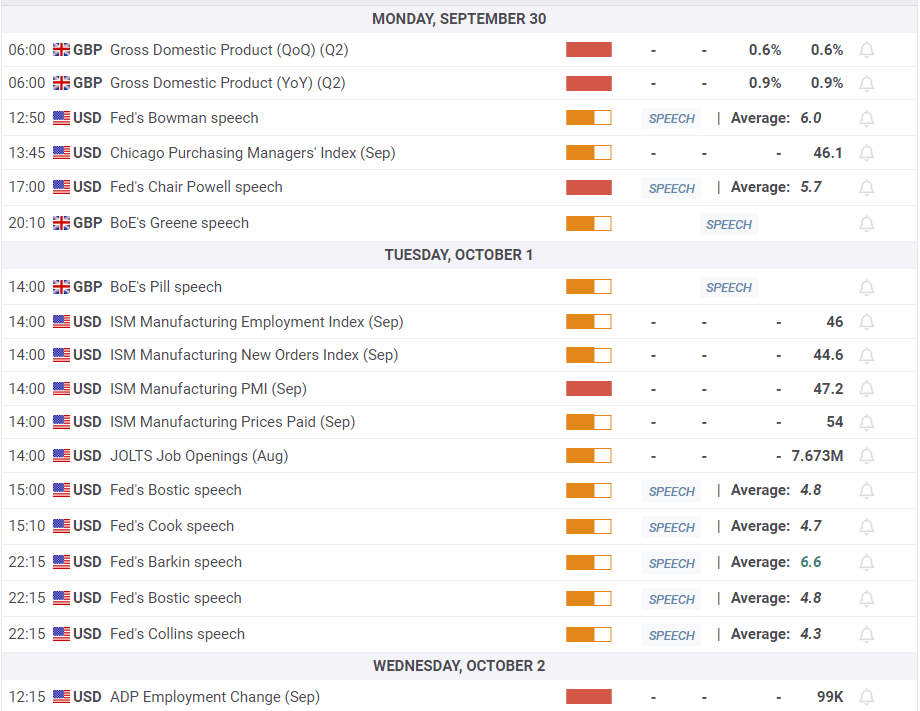
Following a mediocre week in terms of economic data releases, the upcoming week is a busy one, with plenty of top-tier statistics due from the United States. On the other side, the UK docket remains devoid of any relevant macro news.
Monday kicks off with a bang, as Fed Chair Jerome Powell is due to participate in a moderated discussion titled "A View from the Federal Reserve Board" at the National Association for Business Economics Annual Meeting in Nashville. BoE policymaker Megan Greene’s speech will follow.
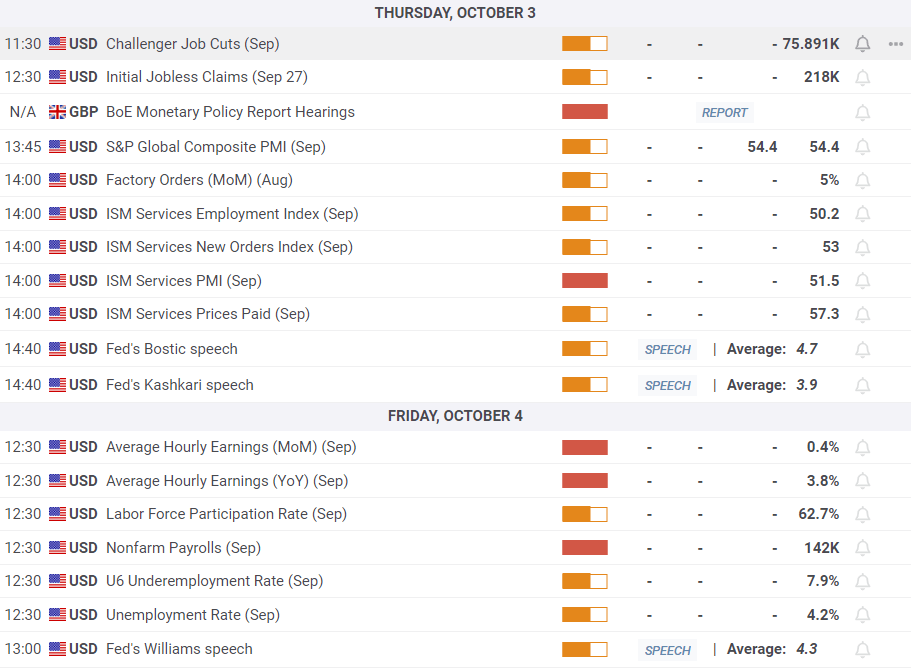
The US ISM Manufacturing PMI and JOLTS Job Openings Survey will grab eyeballs on Tuesday, followed by speeches from Fed officials Raphael Bostic and Lisa Cook.
Early Wednesday will feature a bunch of other Fed policymakers speaking at the Technology-Enabled Disruption Conference hosted by the Federal Reserve Bank of Atlanta. Later that day, the ADP Employment Change data will hog the limelight in American trading alongside more Fedspeak.
The US ISM Services PMI will be reported on Thursday as traders’ focus shifts toward the all-important Nonfarm Payrolls (NFP) slated for release on Friday.
Speeches from Fed officials and the Middle East geopolitical developments will continue to drive the sentiment around the US Dollar, in turn, affecting the GBP/USD pair.
GBP/USD: Technical Outlook
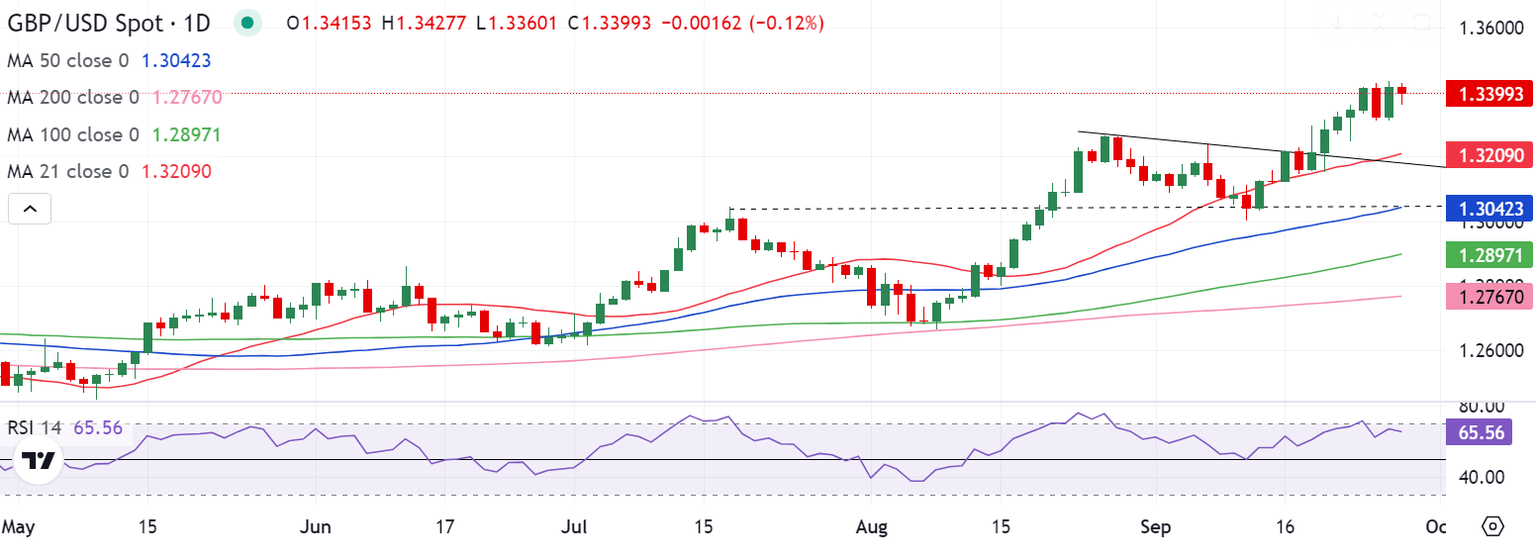
As observed on the daily chart, the GBP/USD pair extended the upside break of the falling trendline resistance, then at 1.3199, to briefly regain the 1.3400 level.
The path of least resistance appears to the upside for the pair, in the absence of any firm resistance levels. Pound Sterling buyers could challenge the initial hurdle at the 1.3500 round level on their way to the February 24, 2022 high of 1.3550.
Acceptance above that level will open doors for a test of the February 2022 high of 1.3644. The next bullish bet aligns at 1.3700.
The 14-day Relative Strength Index (RSI) remains within bullish territory, well above the 50 level, suggesting that more gains remain in the offing.
Alternatively, any pullback could meet initial demand at the September 23 low of 1.3249, below which the falling trendline resistance now turned support at around 1.3200 will be challenged. At that level, the 21-day Simple Moving Average (SMA) coincides.
Additional declines could target the July 17 high of 1.3045, where the 50-day SMA hangs around. The 100-day SMA at 1.2897 will be the last line of defense for buyers.
Premium
You have reached your limit of 3 free articles for this month.
Start your subscription and get access to all our original articles.
Author

Dhwani Mehta
FXStreet
Residing in Mumbai (India), Dhwani is a Senior Analyst and Manager of the Asian session at FXStreet. She has over 10 years of experience in analyzing and covering the global financial markets, with specialization in Forex and commodities markets.


