GBP/USD Forecast: Pound Sterling could target new multi-month highs
- GBP/USD preserves its bullish momentum and trades above 1.2850.
- Upbeat UK data help Pound Sterling stay resilient against its rivals.
- June inflation data from the US will be watched closely by market participants.

GBP/USD gained traction in the American session on Wednesday and registered its highest daily close since March. The pair trades in positive territory above 1.2850 in the European session on Thursday.
British Pound PRICE This week
The table below shows the percentage change of British Pound (GBP) against listed major currencies this week. British Pound was the strongest against the New Zealand Dollar.
| USD | EUR | GBP | JPY | CAD | AUD | NZD | CHF | |
|---|---|---|---|---|---|---|---|---|
| USD | -0.07% | -0.47% | 0.50% | -0.11% | -0.12% | 0.75% | 0.25% | |
| EUR | 0.07% | -0.19% | 0.89% | 0.28% | 0.12% | 1.16% | 0.67% | |
| GBP | 0.47% | 0.19% | 1.06% | 0.49% | 0.31% | 1.35% | 0.85% | |
| JPY | -0.50% | -0.89% | -1.06% | -0.61% | -0.60% | 0.40% | -0.21% | |
| CAD | 0.11% | -0.28% | -0.49% | 0.61% | -0.05% | 0.86% | 0.38% | |
| AUD | 0.12% | -0.12% | -0.31% | 0.60% | 0.05% | 1.04% | 0.54% | |
| NZD | -0.75% | -1.16% | -1.35% | -0.40% | -0.86% | -1.04% | -0.49% | |
| CHF | -0.25% | -0.67% | -0.85% | 0.21% | -0.38% | -0.54% | 0.49% |
The heat map shows percentage changes of major currencies against each other. The base currency is picked from the left column, while the quote currency is picked from the top row. For example, if you pick the British Pound from the left column and move along the horizontal line to the US Dollar, the percentage change displayed in the box will represent GBP (base)/USD (quote).
The improving risk mood caused the US Dollar (USD) to lose interest in the American trading hours on Wednesday and allowed GBP/USD to extend its uptrend. Additionally, Bank of England (BoE) Chief Economist Huw Pill said that they still have some work to do before the domestic persistent component of inflation is gone, further supporting Pound Sterling.
The UK's Office for National Statistics reported on Thursday that the real Gross Domestic Product (GDP) grew by 0.4% on a monthly basis in May. This reading followed the no change recorded in April and came in better than the market expectation for an expansion of 0.2%, helping GBP/USD stretch higher.
Inflation in the US, as measured by the change in the Consumer Price Index (CPI), is forecast to soften to 3.1% in June from 3.3% in May. The core CPI, which excludes volatile food and energy prices, is expected to rise 0.2% on a monthly basis.
In case the monthly core CPI reading comes in line, or below, the market forecast, the USD could come under renewed selling pressure and open the door for another leg higher in GBP/USD. On the flip side, a monthly increase of 0.3% or stronger in core CPI could cause investors to doubt a Federal Reserve (Fed) rate cut in September and trigger a downward correction in the pair.
GBP/USD Technical Analysis
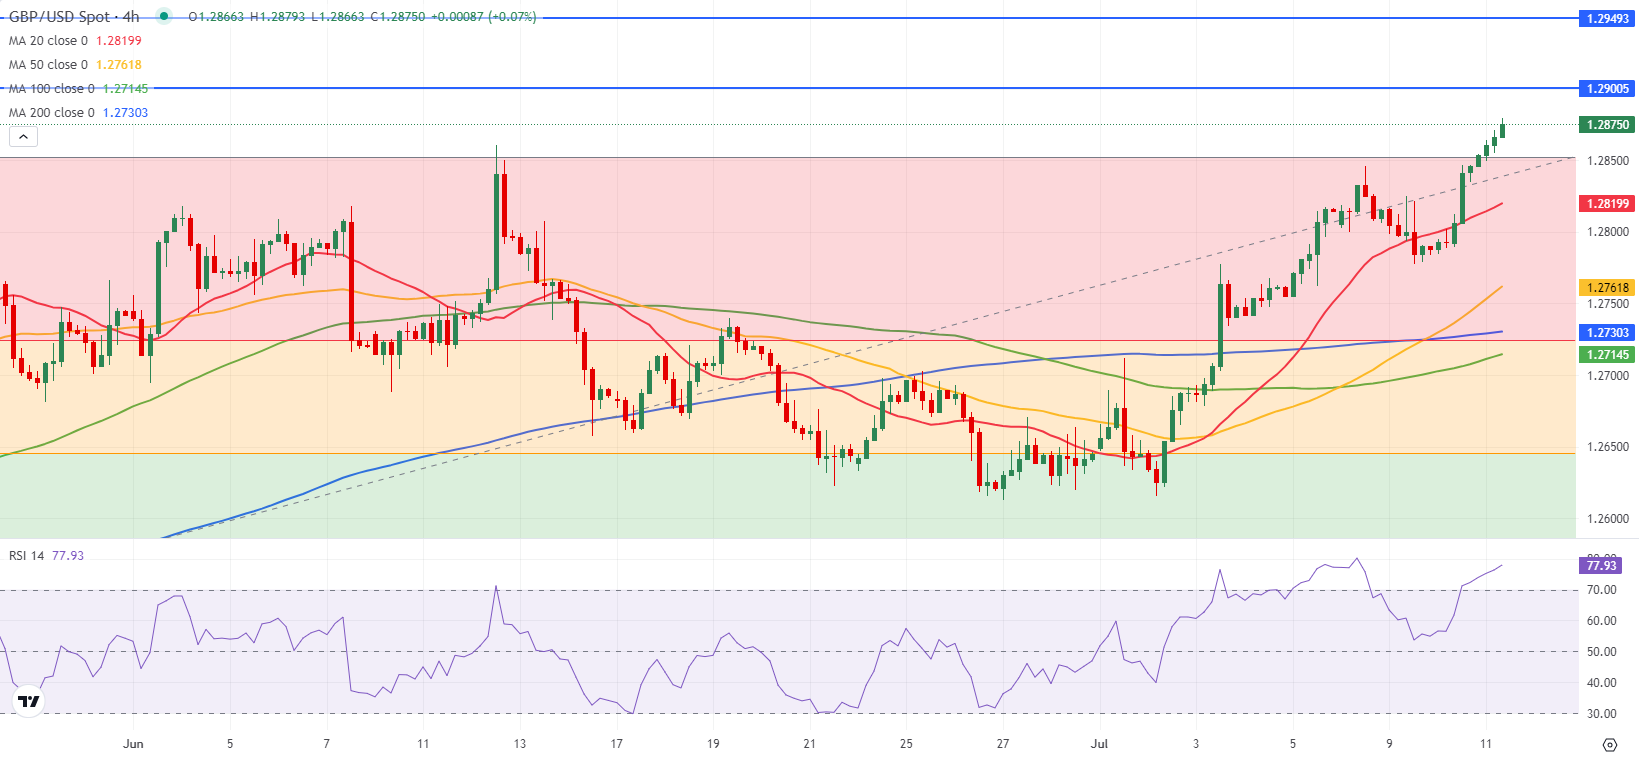
The Relative Strength Index (RSI) indicator on the 4-hour chart rises toward 80, reflecting overbought conditions for the pair. Nevertheless, investors could ignore this technical development while reacting to a soft US inflation print.
1.2900 (psychological level, static level) aligns as first resistance before 1.2940 (static level from July 2023) and 1.3000 (psychological level, static level). On the downside, first support area aligns at 1.2850-1.2860 (static level, June 12 high) before 1.2800 (psychological level, static level).
Inflation FAQs
Inflation measures the rise in the price of a representative basket of goods and services. Headline inflation is usually expressed as a percentage change on a month-on-month (MoM) and year-on-year (YoY) basis. Core inflation excludes more volatile elements such as food and fuel which can fluctuate because of geopolitical and seasonal factors. Core inflation is the figure economists focus on and is the level targeted by central banks, which are mandated to keep inflation at a manageable level, usually around 2%.
The Consumer Price Index (CPI) measures the change in prices of a basket of goods and services over a period of time. It is usually expressed as a percentage change on a month-on-month (MoM) and year-on-year (YoY) basis. Core CPI is the figure targeted by central banks as it excludes volatile food and fuel inputs. When Core CPI rises above 2% it usually results in higher interest rates and vice versa when it falls below 2%. Since higher interest rates are positive for a currency, higher inflation usually results in a stronger currency. The opposite is true when inflation falls.
Although it may seem counter-intuitive, high inflation in a country pushes up the value of its currency and vice versa for lower inflation. This is because the central bank will normally raise interest rates to combat the higher inflation, which attract more global capital inflows from investors looking for a lucrative place to park their money.
Formerly, Gold was the asset investors turned to in times of high inflation because it preserved its value, and whilst investors will often still buy Gold for its safe-haven properties in times of extreme market turmoil, this is not the case most of the time. This is because when inflation is high, central banks will put up interest rates to combat it. Higher interest rates are negative for Gold because they increase the opportunity-cost of holding Gold vis-a-vis an interest-bearing asset or placing the money in a cash deposit account. On the flipside, lower inflation tends to be positive for Gold as it brings interest rates down, making the bright metal a more viable investment alternative.
Author

Eren Sengezer
FXStreet
As an economist at heart, Eren Sengezer specializes in the assessment of the short-term and long-term impacts of macroeconomic data, central bank policies and political developments on financial assets.


