GBP/USD Forecast: Pound Sterling could stretch lower while 1.2800 resistance holds
- GBP/USD moves sideways below 1.2800 in the European session on Wednesday.
- US ISM Services PMI data could impact the US Dollar's valuation.
- 1.2800 aligns as strong near-term resistance for the pair.

GBP/USD lost 0.3% on Tuesday and snapped a three-day winning streak. The pair moves sideways in a narrow range below 1.2800 in the European session as market focus shifts to key data releases from the US.
Although the US Dollar (USD) struggled to gather strength after the disappointing job openings data on Tuesday, the cautious market mood made it difficult for GBP/USD to gather bullish momentum. The US Bureau of Labor Statistics reported that the number of Job Openings on the last business day of April stood at 8.059 million. This reading came in below the market expectation of 8.34 million.
British Pound PRICE This week
The table below shows the percentage change of British Pound (GBP) against listed major currencies this week. British Pound was the strongest against the Canadian Dollar.
| USD | EUR | GBP | JPY | CAD | AUD | NZD | CHF | |
|---|---|---|---|---|---|---|---|---|
| USD | -0.22% | -0.25% | -0.76% | 0.39% | 0.09% | -0.76% | -1.24% | |
| EUR | 0.22% | -0.01% | -0.54% | 0.62% | 0.18% | -0.54% | -1.03% | |
| GBP | 0.25% | 0.00% | -0.46% | 0.62% | 0.25% | -0.58% | -1.03% | |
| JPY | 0.76% | 0.54% | 0.46% | 1.13% | 0.90% | 0.15% | -0.31% | |
| CAD | -0.39% | -0.62% | -0.62% | -1.13% | -0.33% | -1.14% | -1.64% | |
| AUD | -0.09% | -0.18% | -0.25% | -0.90% | 0.33% | -0.72% | -1.23% | |
| NZD | 0.76% | 0.54% | 0.58% | -0.15% | 1.14% | 0.72% | -0.54% | |
| CHF | 1.24% | 1.03% | 1.03% | 0.31% | 1.64% | 1.23% | 0.54% |
The heat map shows percentage changes of major currencies against each other. The base currency is picked from the left column, while the quote currency is picked from the top row. For example, if you pick the British Pound from the left column and move along the horizontal line to the US Dollar, the percentage change displayed in the box will represent GBP (base)/USD (quote).
Early Wednesday, the marginal improvement seen in market mood helps GBP/USD holds its ground. At the time of press, US stock index futures were up between 0.15% and 0.35%.
Later in the session, the ADP Employment Change and the ISM Services PMI data from the US will be looked upon for fresh impetus. Unless there is a significant divergence in the ADP Employment Change data from the market consensus of 173,000, investors are likely to ignore it ahead of Friday's May jobs report.
The ISM Services PMI is forecast to edge higher to 50.5 from 49.4. A better-than-expected PMI print could support the USD and weigh on GBP/USD. On the other hand, the USD could start weakening against its rivals if the PMI data comes in weaker than April's 49.4 to show an ongoing contraction in the sector's activity at an accelerating pace.
GBP/USD Technical Analysis
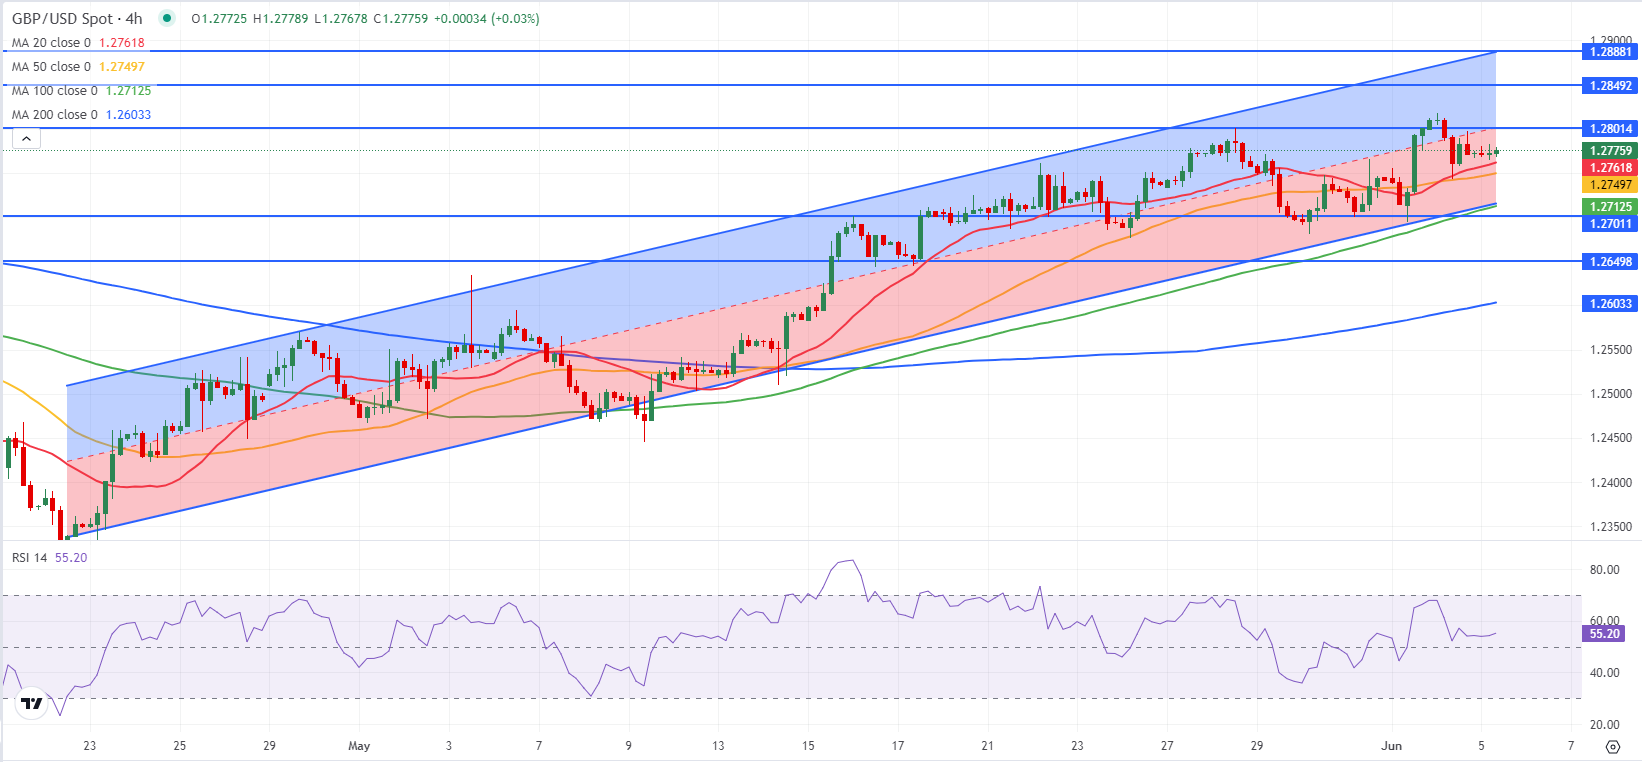
The Relative Strength Index (RSI) indicator on the 4-hour chart moves sideways slightly above 50, reflecting a lack of bullish momentum. 1.2750, where the 20-period and the 50-period Simple Moving Averages (SMA) are located, aligns as immediate support for GBP/USD ahead of 1.2710-1.2700 (, 100-period SMA, lower limit of the ascending channel) and 1.2680 (20-day SMA).
On the upside, resistances could be seen at 1.2800 (mid-point of the ascending channel), 1.2850 (static level) and 1.2890 (upper limit of the ascending channel).
Pound Sterling FAQs
The Pound Sterling (GBP) is the oldest currency in the world (886 AD) and the official currency of the United Kingdom. It is the fourth most traded unit for foreign exchange (FX) in the world, accounting for 12% of all transactions, averaging $630 billion a day, according to 2022 data. Its key trading pairs are GBP/USD, aka ‘Cable’, which accounts for 11% of FX, GBP/JPY, or the ‘Dragon’ as it is known by traders (3%), and EUR/GBP (2%). The Pound Sterling is issued by the Bank of England (BoE).
The single most important factor influencing the value of the Pound Sterling is monetary policy decided by the Bank of England. The BoE bases its decisions on whether it has achieved its primary goal of “price stability” – a steady inflation rate of around 2%. Its primary tool for achieving this is the adjustment of interest rates. When inflation is too high, the BoE will try to rein it in by raising interest rates, making it more expensive for people and businesses to access credit. This is generally positive for GBP, as higher interest rates make the UK a more attractive place for global investors to park their money. When inflation falls too low it is a sign economic growth is slowing. In this scenario, the BoE will consider lowering interest rates to cheapen credit so businesses will borrow more to invest in growth-generating projects.
Data releases gauge the health of the economy and can impact the value of the Pound Sterling. Indicators such as GDP, Manufacturing and Services PMIs, and employment can all influence the direction of the GBP. A strong economy is good for Sterling. Not only does it attract more foreign investment but it may encourage the BoE to put up interest rates, which will directly strengthen GBP. Otherwise, if economic data is weak, the Pound Sterling is likely to fall.
Another significant data release for the Pound Sterling is the Trade Balance. This indicator measures the difference between what a country earns from its exports and what it spends on imports over a given period. If a country produces highly sought-after exports, its currency will benefit purely from the extra demand created from foreign buyers seeking to purchase these goods. Therefore, a positive net Trade Balance strengthens a currency and vice versa for a negative balance.
Author

Eren Sengezer
FXStreet
As an economist at heart, Eren Sengezer specializes in the assessment of the short-term and long-term impacts of macroeconomic data, central bank policies and political developments on financial assets.


