• GBP/USD stays in a consolidation phase above 1.2500 early Friday.
  • The technical picture suggests that the bullish bias remains intact.
  • The 200-day SMA aligns as strong resistance at 1.2560.

GBP/USD closed the third consecutive day in positive territory on Thursday and climbed to its highest level in two weeks at 1.2540 early Friday. The pair retreated toward 1.2500 in the European session but the technical outlook suggests that the bullish bias remains intact.

The US Dollar (USD) weakened against its rivals after disappointing US data on Thursday. The US' Gross Domestic Product (GDP) expanded at an annual rate of 1.6% in the first quarter. This reading followed the 3.4% growth recorded in the last quarter of 2023 and came in below the market expectation for an expansion of 2.5%. 

Early Friday, the positive shift seen in risk mood doesn't allow the USD to gather strength and helps GBP/USD hold its ground. At the time of press, S&P Futures were up 0.65% on the day. In case Wall Street's main indexes open decisively higher, the USD could come under renewed selling pressure in the American session.

The US Bureau of Economic Analysis (BEA) will release the Personal Consumption Expenditures (PCE) Price Index data for March later in the day. On Thursday, the BEA said in the GDP report that the PCE Price Index rose 3.4% on a quarterly basis in the first quarter.

The CME FedWatch Tool shows that markets see a nearly 90% chance that the Federal Reserve (Fed) will leave the policy rate unchanged in June. Given that investors already saw the quarterly change in the PCE Price Index, the monthly data is unlikely to influence the Fed's rate outlook in a meaningful way. Hence, the market reaction to the monthly PCE inflation print could remain short-lived.

GBP/USD Technical Analysis

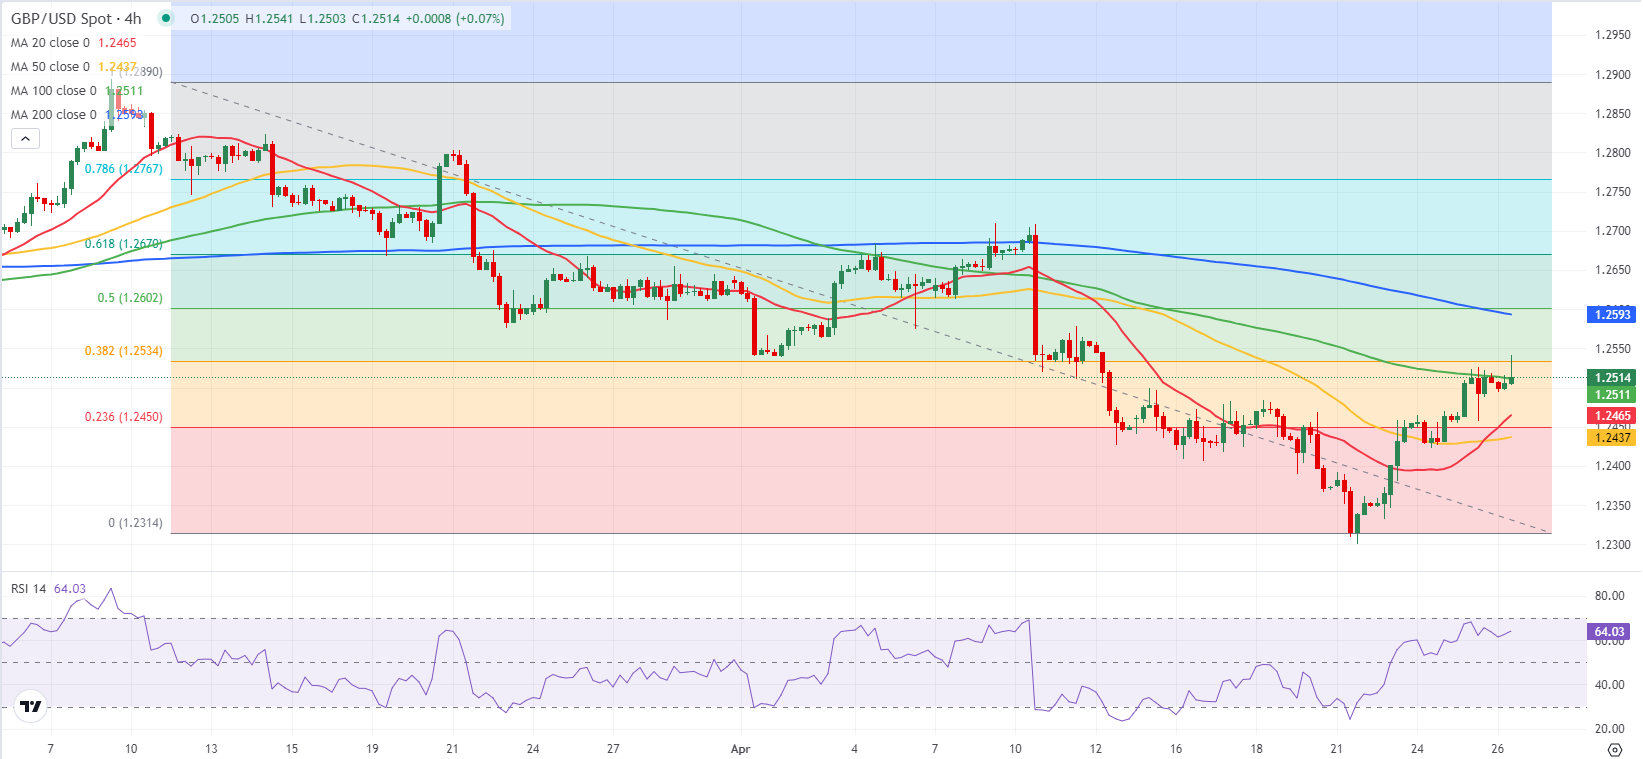
The Relative Strength Index on the 4-hour chart stays above 60 and the gap between the 20-period and the 50-period Simple Moving Averages (SMA) continues to widen following the bullish cross, highlighting the bullish bias.

On the upside, 1.2530 (Fibonacci 38.2% retracement of the latest downtrend) aligns as immediate resistance before 1.2560 (200-day SMA). Supports are located at 1.2450 - 1.2440 (Fibonacci 23.6% retracement, 50-period SMA) and 1.2400 (psychological level, static level).

Information on these pages contains forward-looking statements that involve risks and uncertainties. Markets and instruments profiled on this page are for informational purposes only and should not in any way come across as a recommendation to buy or sell in these assets. You should do your own thorough research before making any investment decisions. FXStreet does not in any way guarantee that this information is free from mistakes, errors, or material misstatements. It also does not guarantee that this information is of a timely nature. Investing in Open Markets involves a great deal of risk, including the loss of all or a portion of your investment, as well as emotional distress. All risks, losses and costs associated with investing, including total loss of principal, are your responsibility. The views and opinions expressed in this article are those of the authors and do not necessarily reflect the official policy or position of FXStreet nor its advertisers. The author will not be held responsible for information that is found at the end of links posted on this page.

If not otherwise explicitly mentioned in the body of the article, at the time of writing, the author has no position in any stock mentioned in this article and no business relationship with any company mentioned. The author has not received compensation for writing this article, other than from FXStreet.

FXStreet and the author do not provide personalized recommendations. The author makes no representations as to the accuracy, completeness, or suitability of this information. FXStreet and the author will not be liable for any errors, omissions or any losses, injuries or damages arising from this information and its display or use. Errors and omissions excepted.

The author and FXStreet are not registered investment advisors and nothing in this article is intended to be investment advice.

Recommended Content


Recommended Content

Editors’ Picks

EUR/USD rises toward 1.0800 on USD weakness

EUR/USD rises toward 1.0800 on USD weakness

EUR/USD trades in positive territory above 1.0750 in the second half of the day on Monday. The US Dollar struggles to find demand as investors reassess the Fed's rate outlook following Friday's disappointing labor market data. 

EUR/USD News

GBP/USD closes in on 1.2600 as risk mood improves

GBP/USD closes in on 1.2600 as risk mood improves

Following Friday's volatile action, GBP/USD pushes higher toward 1.2600 on Monday. Soft April jobs report from the US and the improvement seen in risk mood make it difficult for the US Dollar to gather strength.

GBP/USD News

Gold gathers bullish momentum, climbs above $2,320

Gold gathers bullish momentum, climbs above $2,320

Gold trades decisively higher on the day above $2,320 in the American session. Retreating US Treasury bond yields after weaker-than-expected US employment data and escalating geopolitical tensions help XAU/USD stretch higher.

Gold News

Addressing the crypto investor dilemma: To invest or not? Premium

Addressing the crypto investor dilemma: To invest or not?

Bitcoin price trades around $63,000 with no directional bias. The consolidation has pushed crypto investors into a state of uncertainty. Investors can expect a bullish directional bias above $70,000 and a bearish one below $50,000.

Read more

Three fundamentals for the week: Two central bank decisions and one sensitive US Premium

Three fundamentals for the week: Two central bank decisions and one sensitive US

The Reserve Bank of Australia is set to strike a more hawkish tone, reversing its dovish shift. Policymakers at the Bank of England may open the door to a rate cut in June.

Read more

Majors

Cryptocurrencies

Signatures