GBP/USD Forecast: Pound Sterling could extend slide in case 1.2630 turns into resistance
- GBP/USD went into a consolidation phase near 1.2650 in the European morning.
- Technical sellers could remain interested in case 1.2630 support fails.
- Investors await US data releases and FOMC Minutes.

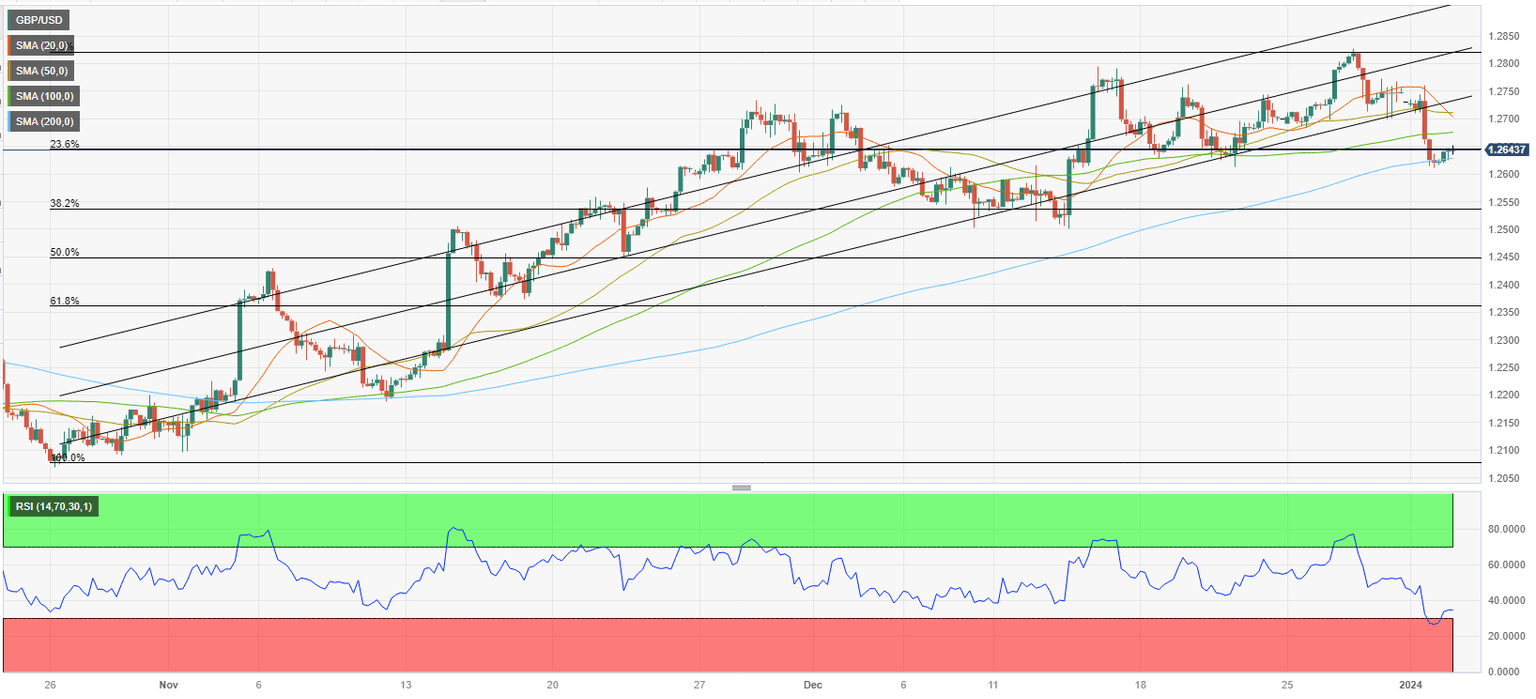
Pressured by the broad-based US Dollar (USD) strength, GBP/USD turned south and declined to its lowest level since mid-December near 1.2600 on Tuesday. Although the pair recovered toward 1.2650 early Wednesday, the technical outlook suggests that the bearish bias remains unchanged.
The decisive rebound seen in the US Treasury bond yields helped the USD outperform its major rivals on the first trading day of 2024. Additionally, the negative shift seen in the risk mood, as reflected by falling US stocks, forced GBP/USD to stay on the back foot.
In the European session, US stock index futures trade virtually unchanged as investors refrain from taking large positions ahead of key macroeconomic data releases from the US.
The ISM Manufacturing PMI is forecast to improve slightly to 47.1 in December from 46.7 in November. JOLTS Job Openings in November are expected to edge higher to 8.85 million from 8.73 million in October. In case both of these figures come in better than analysts' estimates, the USD could regain traction. If the data arrive mixed, markets are likely to wait for the Federal Reserve to release the minutes of the December policy meeting.
According to the CME Group FedWatch Tool, markets are currently pricing in a 75% probability that the Fed will cut the policy rate by 25 basis points in March, suggesting that there is room for renewed USD weakness in case the publication adopts a dovish tone.
In the post-meeting press conference, Fed Chairman Jerome Powell said that policymakers were thinking and talking about when it will be appropriate to cut rates. Investors will look to reaffirm whether officials discussed the timing of a policy pivot.
GBP/USD Technical Analysis
GBP/USD broke below the lower limit of the ascending regression channel and closed the previous five 4-hour candles below the 100-period Simple Moving Average (SMA). Additionally, the Relative Strength Index on the same chart stays below 40, confirming the bearish bias.
On the downside, the 200-period SMA aligns as first support at 1.2630. In case GBP/USD falls below this level and starts using it as resistance, 1.2600 (psychological level) could act as interim support before 1.2550 (Fibonacci 38.2% retracement of the latest uptrend).
Immediate resistance is located at 1.2650 (Fibonacci 23.6% retracement) before 1.2675 (100-period SMA) and 1.2700 (psychological level, static level, 20-period SMA, 50-period SMA).
Premium
You have reached your limit of 3 free articles for this month.
Start your subscription and get access to all our original articles.
Author

Eren Sengezer
FXStreet
As an economist at heart, Eren Sengezer specializes in the assessment of the short-term and long-term impacts of macroeconomic data, central bank policies and political developments on financial assets.


