GBP/USD Forecast: At critical support as construction contracts at the worst in 10 years
- GBP/USD has extended its falls and reached two-week lows.
- Weak UK data and Brexit uncertainty weigh.
- Tuesday's four-hour chart indicates more falls are likely, but strong support may help.

"Worrying signals from the survey's forward-looking indicators make it almost impossible to sugarcoat the construction PMI data in June" is what Markit had to say about the devastating score of 43.1 points – the worst in over 10 years.
The fresh forward-looking purchasing managers' index adds insult to injury for the pound. Sterling had already been suffering from growing uncertainty around Brexit after parliament was unable to vote on a motion that could have blocked a no-deal Brexit. John Bercow, the speaker of the House of Commons, has prevented a vote that would suspend government spending in case the government would push a no-deal exit from the EU.
Foreign secretary Jeremy Hunt – who trails Boris Johnson in the Conservative Party's leadership contest – has set September 30th as the deadline to finalize a new deal with the EU on Brexit. The short timeframe concerns markets. Johnson previously said that the UK must leave by October 31st "do or die". Both candidates' positions are weighing on the pound – which reacts adversely to growing chances of a hard Brexit.
The previous PMI for the manufacturing has also fallen short of forecasts – only 48 points – also below the 50-point threshold that separates expansion from contraction.
On the other side of the Atlantic, the manufacturing sector is still growing according to the ISM Manufacturing PMI – scoring 51.7 points in June – beating expectations. Moreover, the US dollar continues enjoying diminishing expectations for a deep rate cut by the central bank.
John Williams, President of the New York branch of the Federal Bank, will speak later today and may shed some light on the Fed's current thinking.
GBP/USD Technical Analysis
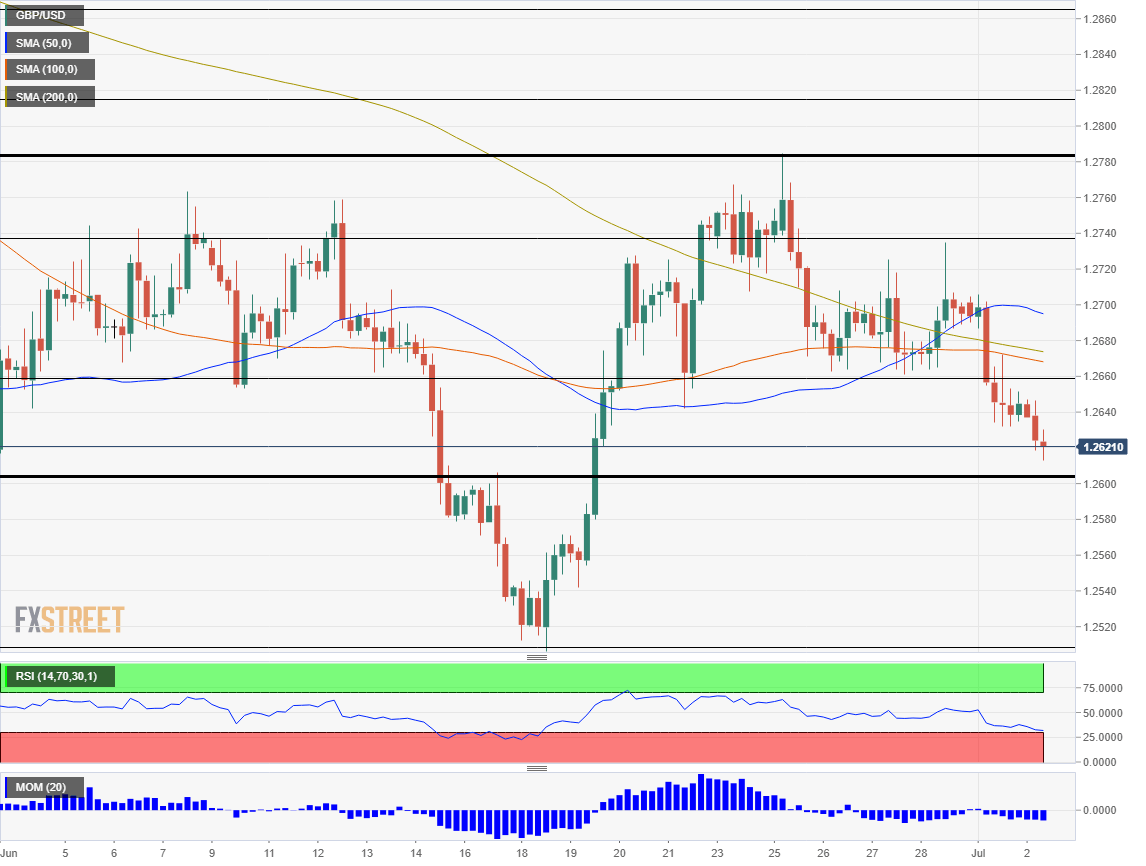
GBP/USD has been suffering from downside momentum and broke below the 50, 100, and 200 Simple Moving Averages on the four-hour chart. Moreover, the Relative Strength Index is leaning lower but still hovers above 30 points – outside oversold territory.
All in all, the bears are in control.
Critical support awaits at 1.2605 which capped GBP/USD in mid-June and provided support in May. Further down, the next considerable cushion is only at 1.2505 which is the lowest since January. The next lines to watch are 1.2475 and 1.2445.
GBP/USD faces resistance at 1.2660 that provided support in late June. It is followed by 1.2740 that capped it around the the same time. Strong resistance is at 1.2780 which was the high point last month.
Author

Yohay Elam
FXStreet
Yohay is in Forex since 2008 when he founded Forex Crunch, a blog crafted in his free time that turned into a fully-fledged currency website later sold to Finixio.














