FX Majors Weekly Preview

After last week’s flurry of central bank policy statements, we have a much calmer looking calendar ahead of us this week. The reduced levels of event risk should create a platform for some trends to develop. Here’s a technical snapshot of how the major pairs are shaping up.
EUR/USD
EUR/USD’s recovery continued last week following the Fed’s decision to maintain its ‘three hikes in 2017’ stance.
If we delve a bit deeper into last week’s price action you’ll see that the rally was equidistant to the previous week’s rally. This ‘harmonic’ price action means that the market has now completed an A,B,C,D pattern. In fact, if we include the rally from 1.0500 at the start of the month we could argue that the market has also completed a ‘three drives’ pattern.
These pattern completions only become significant when we view them in the context of market structure. In EUR/USD’s case we can see that these patterns are completing just before a key area of resistance. The resistance zone is defined by the highest close (1.0797) and highest high (1.0874).
We’ll be paying very close attention to how prices respond to the resistance zone if tested this week.

EUR/USD Daily Candle Chart
GBP/USD
You’ll notice a running theme this week and it centres on prices pressing into key areas of resistance, cable is another example.
Last week’s hawkish tone from the BoE saw cable climb back towards previous support at 1.2400. It took the bears an entire month to break below 1.2400 in February and this memory is likely to impact price behaviour.
Before we get too carried away it’s important to note that short-term momentum in this market is bullish and the pound is displaying decent levels of relative strength. With this in mind it would be wise to only short this market if we receive a clear price action sell signal.
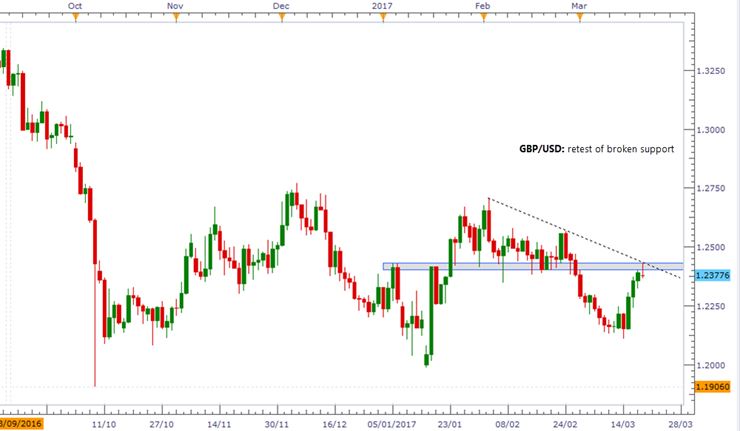
GBP/USD Daily Candle Chart
USD/JPY
USD/JPY failed miserably to hold above 115.00 resistance last week and prices now look destined to re-test support at 112.00.
Buying on support in what remains a long-term bullish technical setup looks to be the most prudent strategy. However we will need to see the dollar regain some its mojo before doing so.
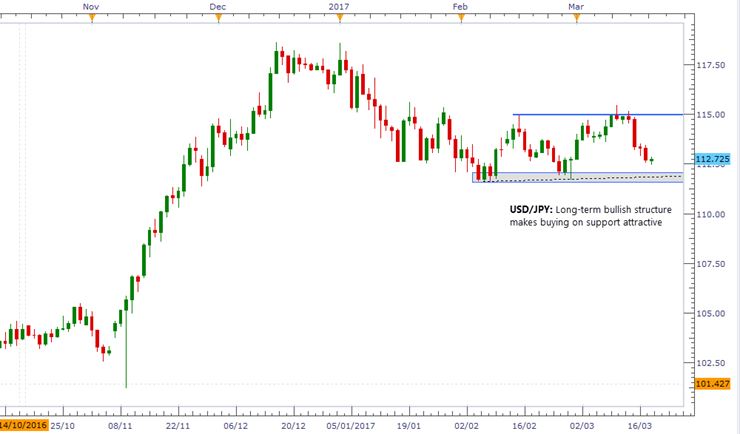
USD/JPY Daily Candle Chart
AUD/USD
The Aussie was the star of the show during last week’s central bank bonanza!
Prices skyrocketed higher following the Fed rate decision and the market has spent the last three sessions consolidating near its highs.
Whilst this ‘high and tight consolidation’ is a very bullish sign we should not ignore the major resistance zone looming close overhead. The ideal short scenario would be for prices to press above the resistance zone, squeezing weak handed bears out of the market before a sharp reversal. However, until this happens we should respect the Aussie’s strength.
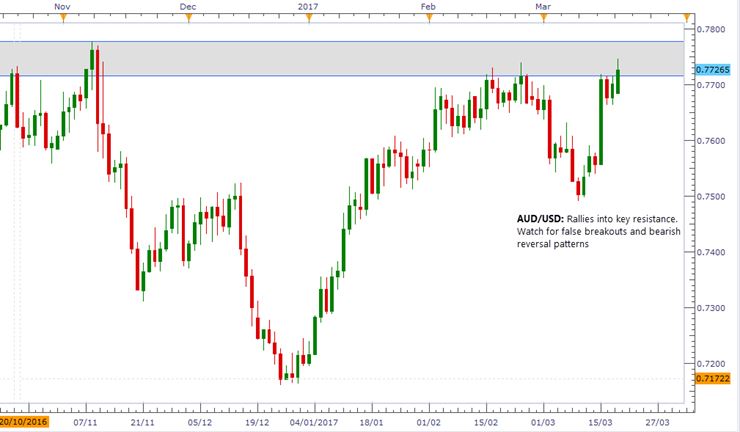
AUD/USD Daily Candle Chart
Author

Jamie Dutta
Faraday Research
Jamie has vast experience in financial markets, having worked in both top-tier institutions and trading houses. He has traded a variety of different products during his professional career and combines technical analysis with deep


