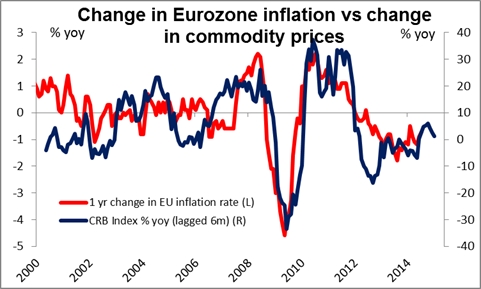
Plunging commodities take center stage The focus in the markets yesterday was commodities, not currencies, as several commodities suffered large declines. WTI was down about 3.4% and natural gas fell even more. Copper and nickel fell sharply (1.1% and 2.2% respectively on the LME), even though China cut mortgage rates and took several steps to make it easier for people to buy a second or even third home in an effort to boost their property market. Copper is used in electrical wiring and nickel is used in making steel, so the large declines in those particular metals was a strong vote of no confidence in the Chinese measures. Agricultural commodities were generally lower as well; corn hit a five-year low on higher-than-expected inventories. Overall, Q3 was the worst quarter since 2008 for commodities on rising supply, slowing growth in China and a surging dollar.
Is it any surprise then that AUD was the weakest of the G10 currencies, followed by CAD? NZD fell too but nowhere near as much, but that may just be because it has gotten hit so hard recently anyway. Europe should be a beneficiary of lower commodity prices, but since the big concern in Europe is deflation, falling commodity prices just make it harder for the ECB to reach its inflation target – hence EUR-negative, oddly enough. I would expect however that the three commodity currencies will continue to be the ones most affected by lower commodity prices.
Falling commodity prices did not affect EM currencies the way one might have expected. Commodity importers KRW and PLN were the weakest of the ones we track, only then followed by commodity exporter ZAR. (There’s apparently some speculation that the South Korean authorities may intervene to weaken their currency.) RUB was fairly low down the list of falling currencies despite the talk of capital controls in the country, not to mention the collapse in oil prices. And oil exporter MXN actually gained vs USD.
The tankan: Japan’s tankan, the Bank of Japan’s short-term survey of economic trends, was generally better than expected. The large manufacturers’ diffusion index actually rose instead of falling as expected, while large companies revised up their forecast for capital spending significantly. I would’ve expected this to be positive for the yen, as indeed it was initially, but over the rest of the day the line of causation seemed to be tankan stocks USD/JPY. Since the stock market was up slightly, USD/JPY was up slightly too, i.e. the yen weakened. This is the trend I expect anyway and as the technical comment below says, we see USD/JPY moving still higher.
Today’s indicators: Wednesday is a (final) PMI day in Europe. It starts with the manufacturing PMI figures for September from several European countries, including the UK, and the final figure for the Eurozone as a whole. As usual, the final forecasts for the French, the German and Eurozone’s figures are the same as the initial estimates. The UK manufacturing PMI is estimated to be slightly up to 52.7 from 52.5, which could support GBP.
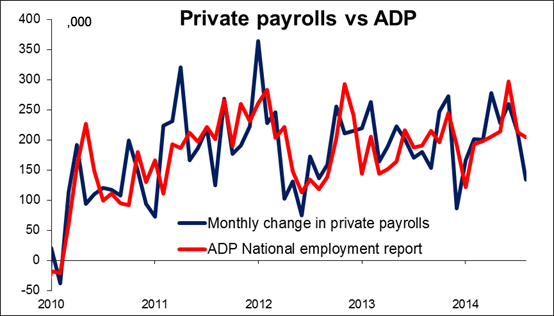
In the US, the most important indicator we get is the ADP employment report for September two days ahead of the NFP release. The ADP report is expected to show that the private sector gained slightly more jobs in September than it did last month. That would probably be USD-supportive and add to the USD rally. The final Markit service sector PMI and the ISM non-manufacturing index both for September are also to be released.
From Canada, the RBC Manufacturing PMI for September is expected with no forecast available.
We have no speakers scheduled on Wednesday.
The Market
EUR/USD tumbled on Tuesday
EUR/USD tumbled on Tuesday after the Eurozone’s CPI slowed in September to its lowest level since November 2009. The pair broke our support-turned-into-resistance level of 1.2660 and moved lower to find support at 1.2568 (S1) line. Looking at our momentum studies, both indicators are trading along their levels at the oversold market zones. The RSI already at its 30 line is pointing down, while MACD crossed below its trigger line. These momentum signs increase the likelihood for further declines. On the daily chart, the pair is printing lower highs and lower lows and so I maintain my view that the overall path is to the downside. A dip below the 1.2568 (S1) could pave the way towards the psychological level of 1.2500 (S2).
Support: 1.2568 (S1), 1.2500 (S2), 1.2460 (S3).
Resistance: 1.2660 (R1), 1.2693 (R2), 1.2760 (R3).
GBP/USD moved in a consolidative mode
GBP/USD moved in a consolidative mode, remaining between the support line of 1.6160 (S1) and 1.6280 (R1) resistance level. As long as I don’t see a clear trending structure on the 4-hour chart, I would prefer to remain neutral. A clear dip below the support level of 1.6160 (S1) is needed before getting more confident about larger declines. Our momentum studies show that the RSI remains fractionally above its 30 line and is pointing down, while the MACD already in its negative territory moves sideways with its trigger line. This is another reason I would prefer to stay neutral.
Support: 1.6160 (S1), 1.6070 (S2), 1.6000 (S3).
Resistance: 1.6280 (R1), 1.6400 (R2), 1.6500 (R3).
USD/JPY testing the psychological line of 110.00
USD/JPY surged yesterday and broke above the resistance-turned-into-support line of 109.25. During early European morning the pair is testing the psychological line of 110.00 (R1), where a clear break could trigger further extensions towards our next resistance of 110.70 (R2) zone. In the bigger picture, I still see a long-term uptrend, since, after the exit of a triangle on the daily chart, the price structure remains higher peaks and higher troughs above both the 50- and the 200-day moving averages.
Support: 109.25 (S1), 108.25 (S2), 107.40 (S3).
Resistance: 110.00 (R1), 110.70 (R2), 111.60 (R3).
Gold breaks below 1208
Gold moved lower yesterday, breaking below the 1208 (support turned into resistance) barrier. However, the precious metal remained fractionally below the lower boundary of the blue line channel where it has been consolidating since 17th of September. Since we approach a key psychological level of 1200 (S1), I would prefer to remain flat and wait for a dip below that level for further bearish extensions. On the daily chart, the price structure still suggests a downtrend, but our daily momentum indicators give me an extra reason to remain flat. The 14-day RSI returned to its oversold field and is now pointing down, while the daily MACD despite signs of topping does not seem ready to cross above its signal line.
Support: 1200 (S1), 1180 (S2), 1160 (S3).
Resistance: 1208 (R1), 1225 (R2), 1240 (R3).
WTI plunged
WTI plunged yesterday, violating two support lines in a row. The move was halted at the 90.80 (S1) zone and during early European morning WTI is advancing towards support-turned-into resistance 92.00 (R1) level. Although we had a sharp drop, I would prefer to remain neutral as the price structure does not suggest trending conditions. The MACD lies below both its signal and zero lines, confirming yesterday’s strong negative momentum, but the RSI found resistance at its 70 line and fell down to bounce again from its oversold level. These mixed momentum signals give me another reason to remain flat, at least for now.
Support: 90.80 (S1), 90.00 (S2), 89.50 (S3).
Resistance: 92.00 (R1), 94.00 (R2) , 96.00 (R3).
BENCHMARK CURRENCY RATES - DAILY GAINERS AND LOSERS
MARKETS SUMMARY
Recommended Content
Editors’ Picks
EUR/USD eases to near 1.0700 ahead of German inflation data

EUR/USD is paring gains to near 1.0700 in the European session on Monday. The pair stays supported by a softer US Dollar, courtesy of the USD/JPY sell-off and a risk-friendly market environment. Germany's inflation data is next in focus.
USD/JPY recovers after testing 154.50 on likely Japanese intervention

USD/JPY is recovering ground after sliding to 154.50 on what seemed like a Japanese FX intervention. The Yen tumbled in early trades amid news that Japan's PM lost 3 key seats in the by-election. Focus shifts to the US employment data and the Fed decision later this week.
Gold price holds steady above $2,335, bulls seem reluctant amid reduced Fed rate cut bets

Gold price (XAU/USD) attracts some buyers near the $2,320 area and turns positive for the third successive day on Monday, albeit the intraday uptick lacks bullish conviction.
Ripple CTO shares take on ETHgate controversy, XRP holders await SEC opposition brief filing

Ripple loses all gains from the past seven days, trading at $0.50 early on Monday. XRP holders have their eyes peeled for the Securities and Exchange Commission filing of opposition brief to Ripple’s motion to strike expert testimony.
Week ahead: FOMC and jobs data in sight

May kicks off with the Federal Open Market Committee meeting and will be one to watch, scheduled to make the airwaves on Wednesday. It’s pretty much a sealed deal for a no-change decision at this week’s meeting.

