Forex technical analysis and forecast: Majors, equities and commodities
EUR/USD, “Euro vs US Dollar”
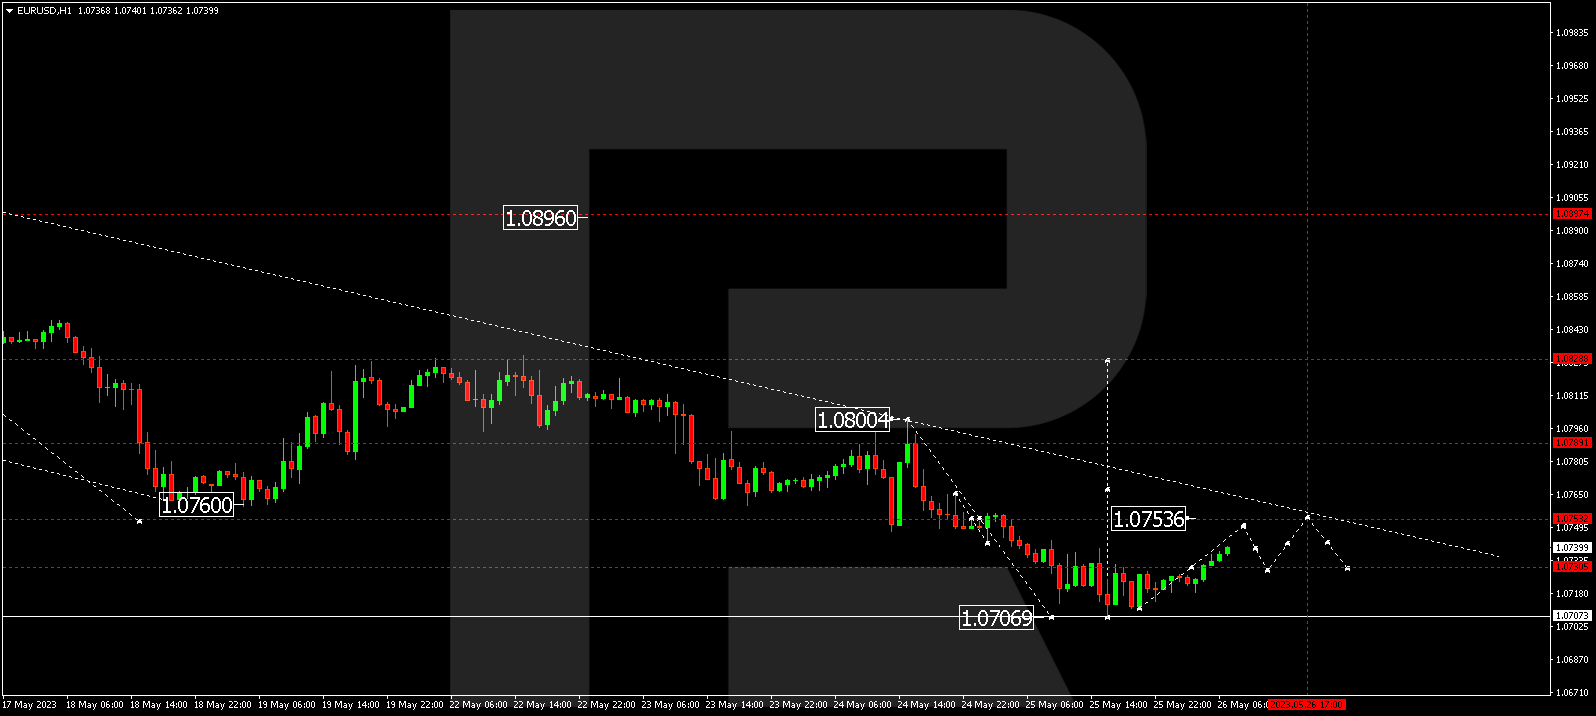
The currency pair has completed a wave of decline to 1.0707. Today the market has started developing a correction to 1.0755. This is the first target. After the price reaches this level, a correction might follow to 1.0730. Next, growth to 1.0790 is expected.
GBP/USD, “Great Britain Pound vs US Dollar”
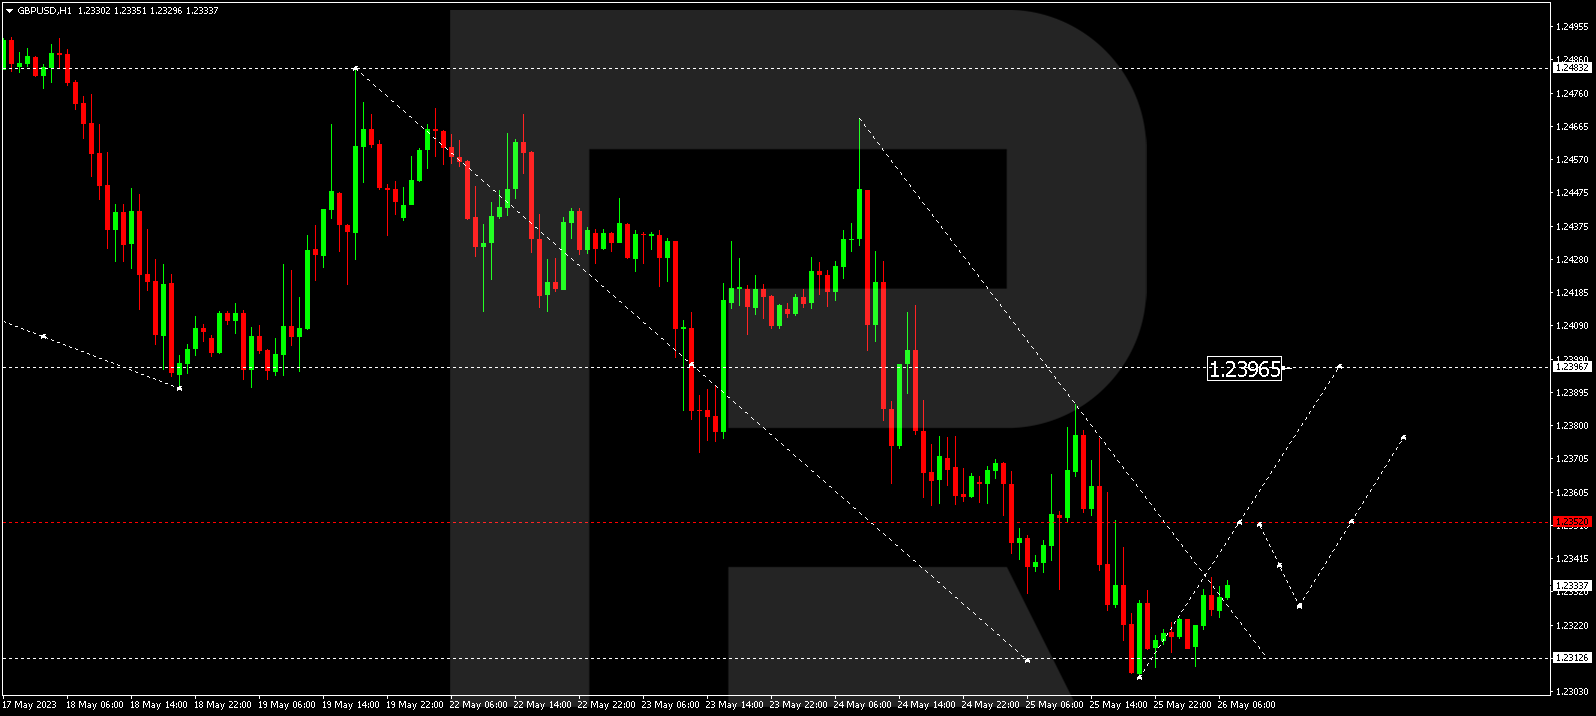
The currency pair has completed a wave of decline to 1.2307. Today the market has formed a consolidation range above this level and, escaping the range upwards, suggests continuing the wave of growth to 1.2352. After the price reaches this level, a link of correction to 1.2330 could follow. Next, growth to 1.2395 is expected.
USD/JPY, “US Dollar vs Japanese Yen”
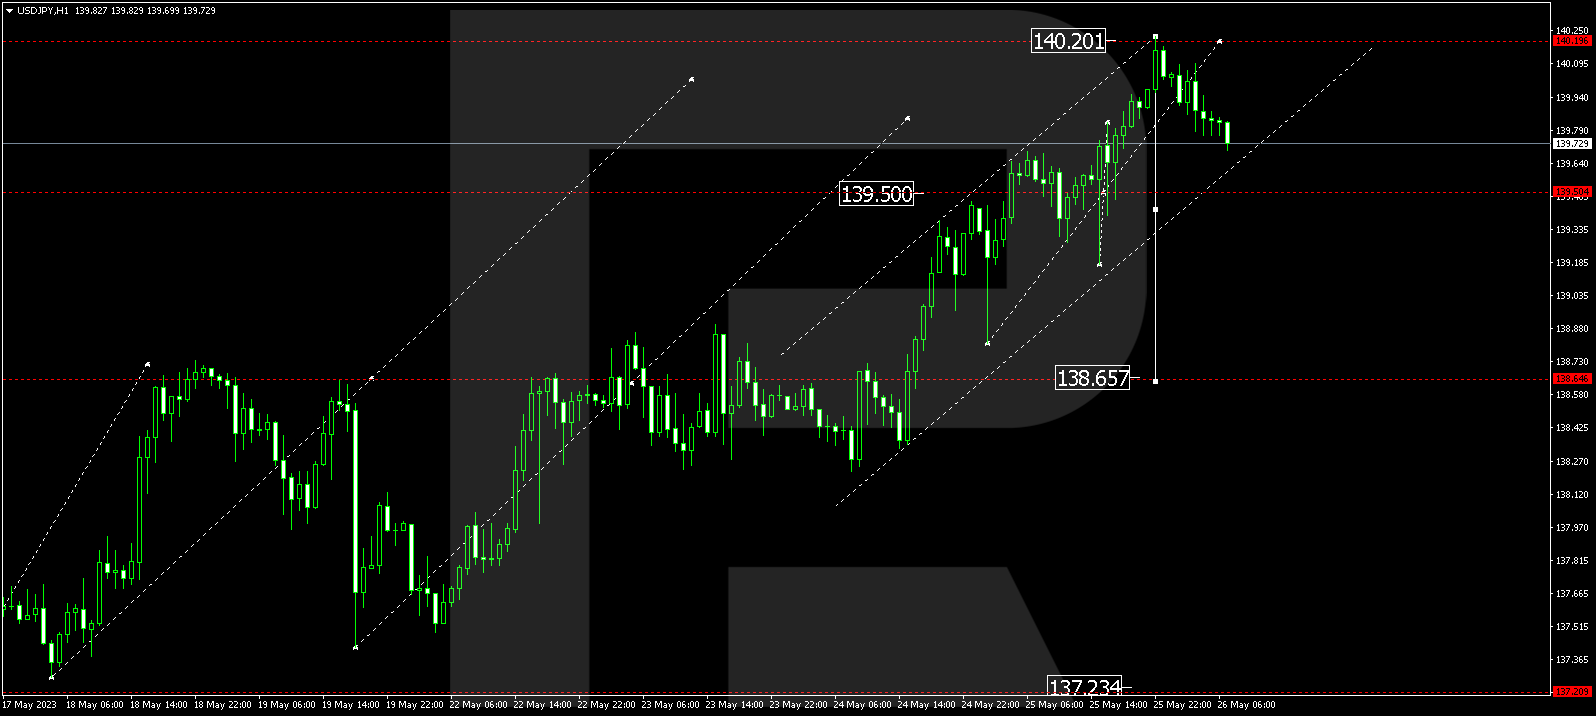
The currency pair formed a consolidation range around 139.50, escaped it upwards, and completed a structure of growth to 140.20. Today the market has started developing a wave of decline to 139.50. After the price reaches this level, a correction to 139.80 could follow. Next, a decline to 138.65 is expected.
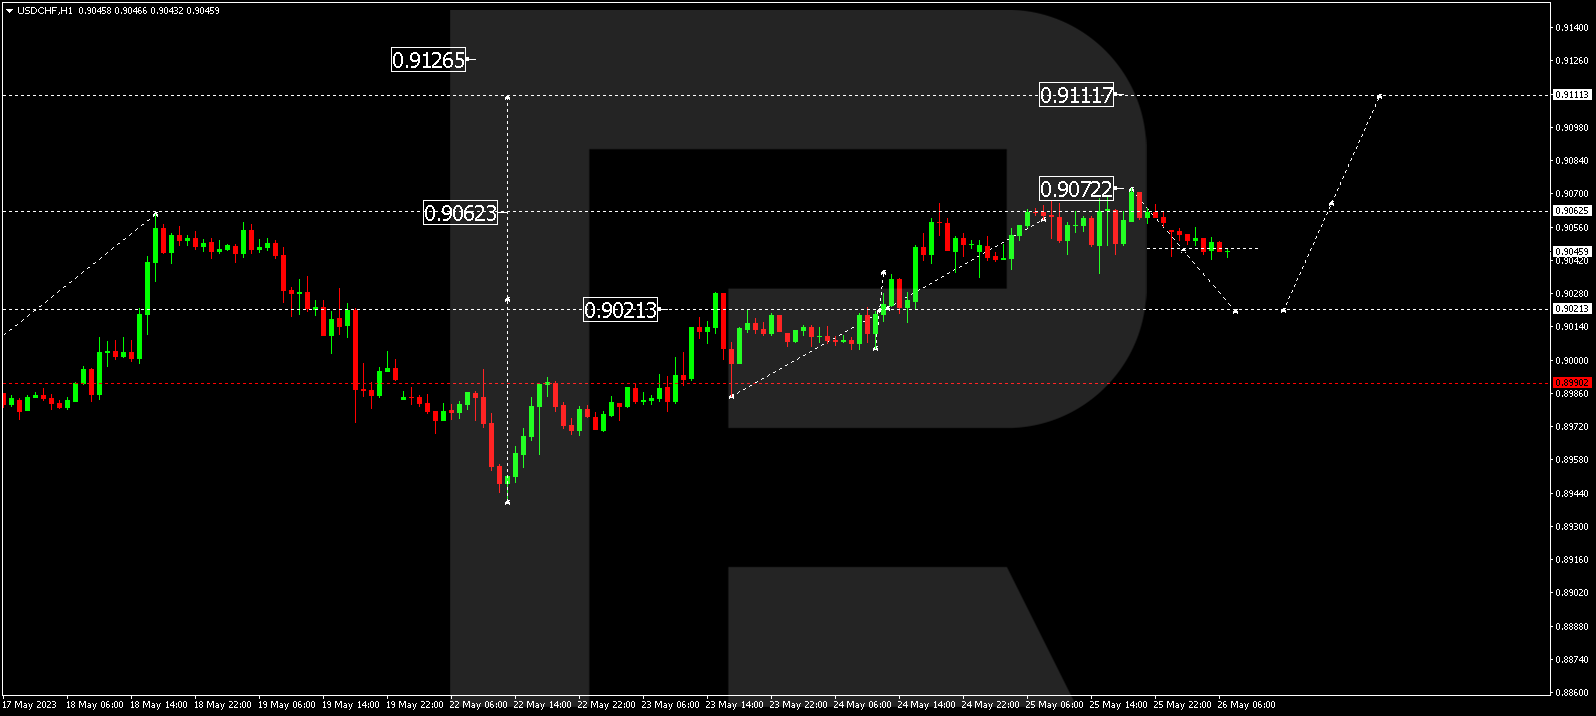
USD/CHF, “US Dollar vs Swiss Franc”
The currency pair has completed a wave of growth to 0.9072. Today the market is forming a correction to 0.9020. After it is over, the wave of growth might continue to 0.9111.
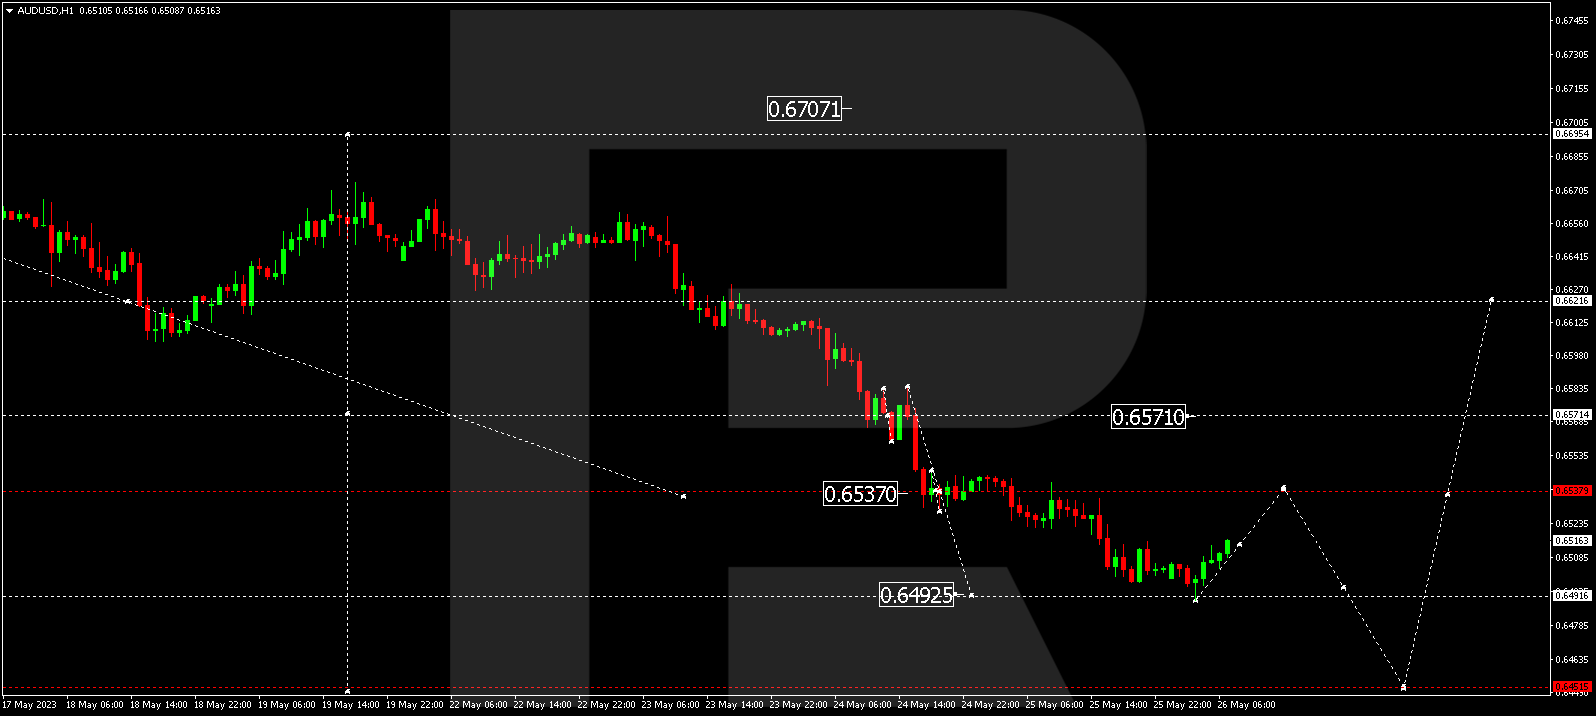
AUD/USD, “Australian Dollar vs US Dollar”
The currency pair has completed a wave of decline to 0.6493. Today the market is forming a structure of corrective growth to 0.6540. Next, a structure of decline could develop to 0.6455.
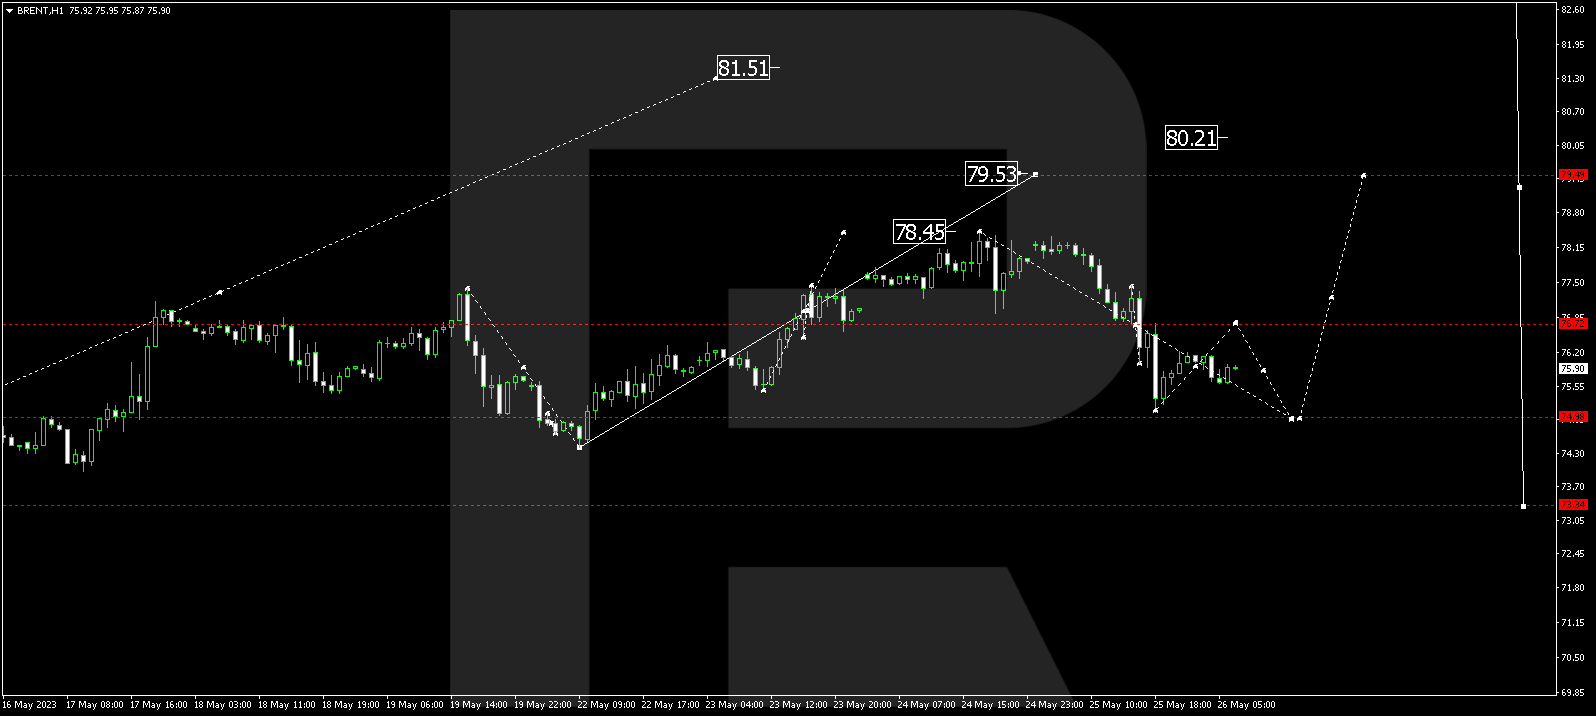
Brent
Brent has formed a consolidation range around 76.76 and, escaping it downwards, suggests a correction to 75.00. After the correction will be over, a new wave of growth to 79.55 might start that could extend to 80.20.
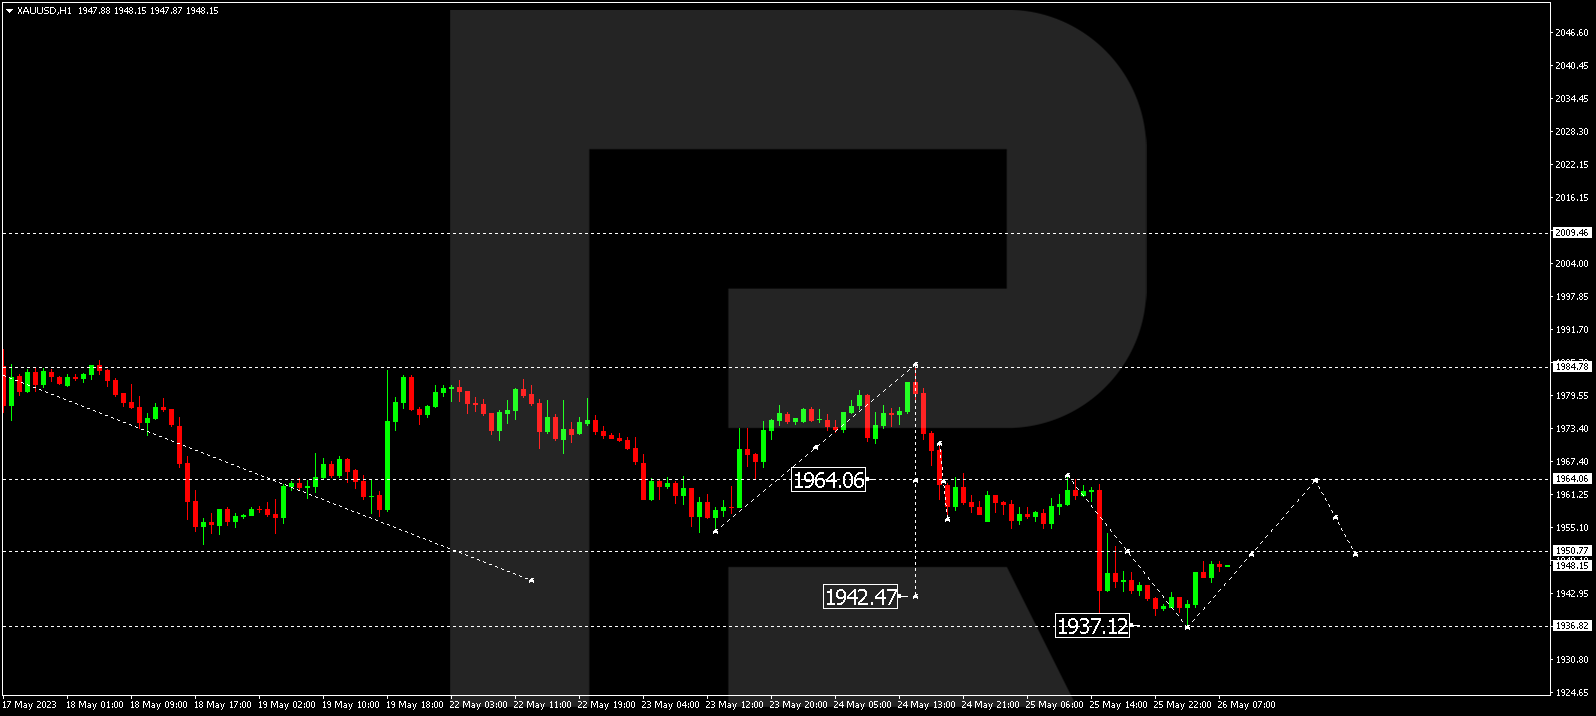
XAU/USD, “Gold vs US Dollar”
Gold has completed a wave of decline to 1936.76. Today the market is beginning a wave of growth to 1964.00. After the price reaches this level, a correction to 1950.00 could follow. Next, a new wave of growth to 1984.00 might start.
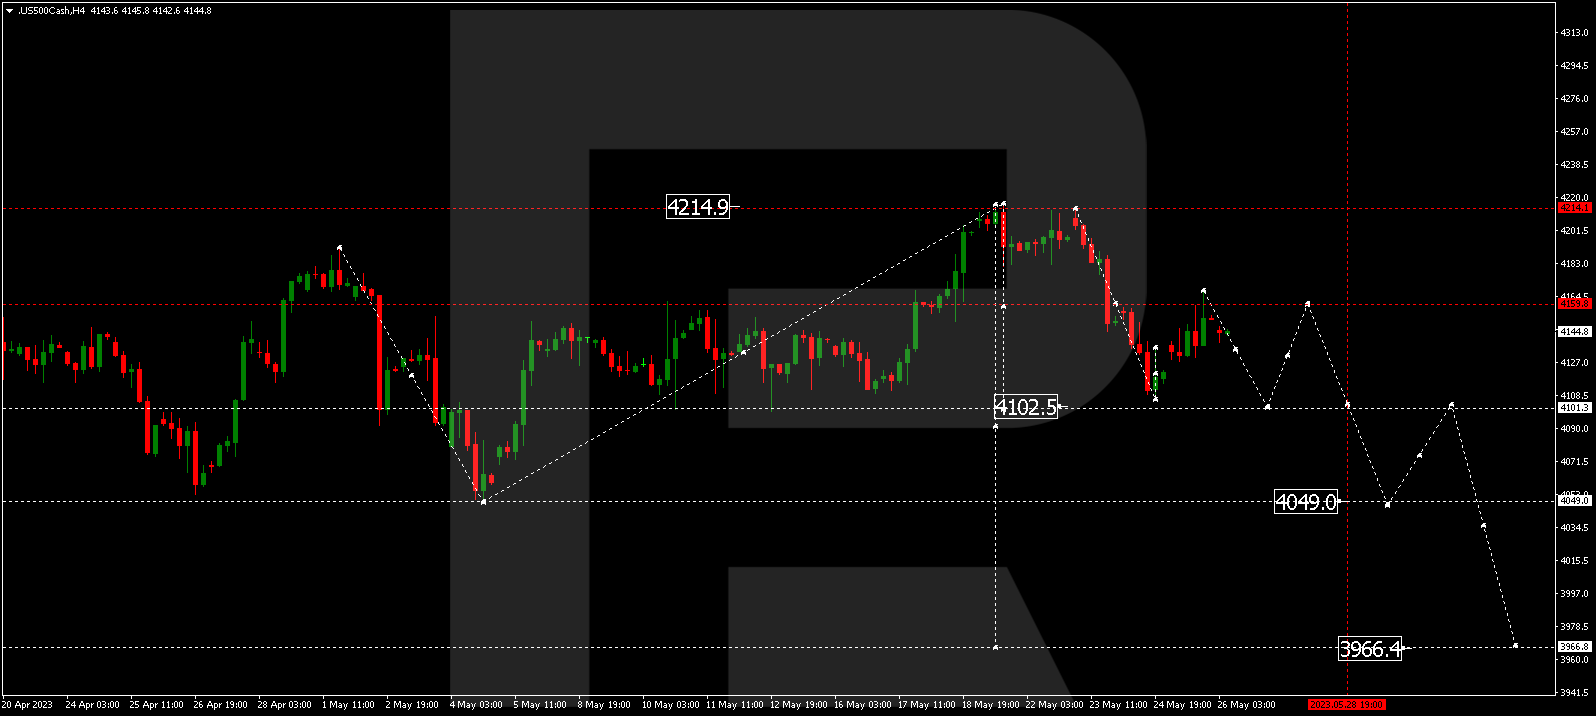
S&P 500
The stock index has completed a wave of decline to 4106.0. Today the market has corrected to 4160.0. A new wave of decline to 4102.0 is expected. This is the first target. After the price reaches this level, a correction to 4150.0 could form, followed by a decline to 4050.0.
Author

RoboForex Team
RoboForex
RoboForex Team is a group of professional financial experts with high experience on financial market, whose main purpose is to provide traders with quality and up-to-date market information.


