Welcome to my "Strength and Comparison" article for the coming week.
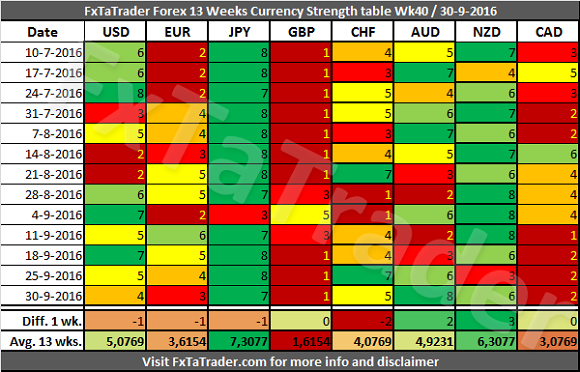
When looking at the Currency Strength in the table here below we can see that the CAD lost a lot of strength in the last 4 weeks. The CHF and the AUD became stronger in the last week and the USD became weaker in the last 2 weeks. For more details read both of my articles where the necessary Charts and Tables are provided.
______________________________________
13 Weeks Currency Score Strength
The 13 Weeks Currency Strength and the 13 Weeks Average are provided here below. This data and the "13 weeks Currency Classification" are considered for deciding on the preferred range. Because it is not ideal nor desired to change the range for a currency every single week, we perform several checks to avoid this.
- First of all the strength over a period of 13 weeks. See each row for more information.
- Then the 13 weeks average, see the last row called "Avg. 13 wks."
- The number of weeks that a currency is stronger than another currency can also be evaluated.
- The TA Charts for each Time Frame can also be consulted.
For analyzing the best pairs to trade looking from a longer term perspective the last 13 weeks Currency Classification can be used in support.
This was updated on 25 September 2016 and is provided here for reference purposes:
Strong: USD, JPY, NZD. The preferred range is from 6 to 8.
Average: CHF, AUD. The preferred range is from 4 to 5.
Weak: EUR, GBP, CAD. The preferred range is from 1 to 3.
_____________________________________
The Strong Currencies
In the last 2 weeks the USD became weaker. According to the Currency Strength table here above the Avg. 13 Weeks of the USD is slightly higher compared to the AUD which is an average currency. The USD scored also only 7 times higher than the AUD in the last 13 weeks. Some Classification changes may occur in the coming weeks with the mentioned currencies.
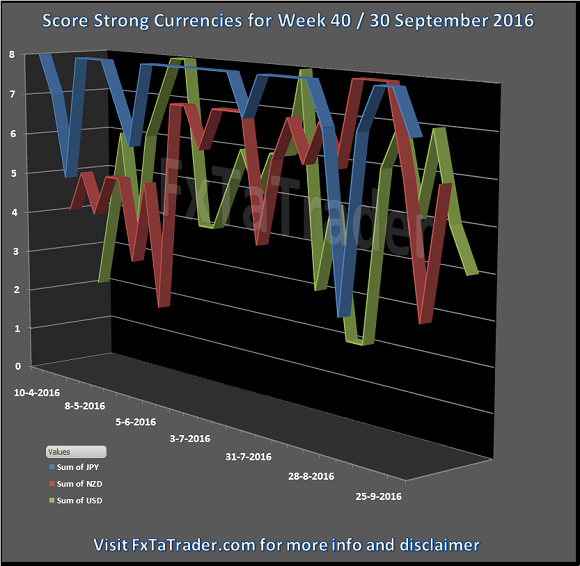
The JPY is clearly the strongest currency and the NZD had a 1 bad week but recovered. Here below you can see the Weekly Currency Score Chart with 6 months data as a reference.
____________________________________
Currency Score Comparison
"Comparison table" and the "Ranking and Rating list"
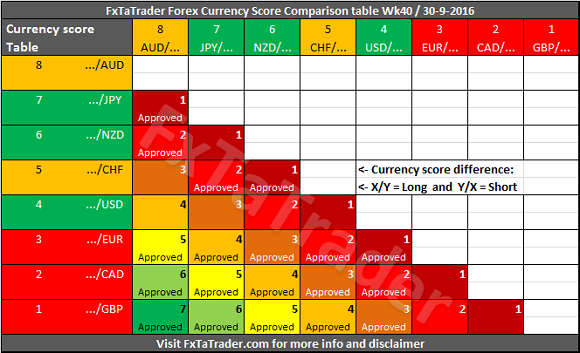
The Forex Currency Comparison Table compares each currency with its counterpart based on the Currency Score. For more information about the currency Score of this week you can read the article "Forex Ranking, Rating and Score" which is published every week together with this article.
By using the comparison table directly below you can get a view without the volatility and statistics as opposed to the "Ranking and Rating list". Only the strength of each currency against the counterparts is analyzed by using the Technical analysis charts of the 4 Time Frames that are also used for the "Ranking and Rating List".
The information from the Comparison Table is the source for calculating the "Ranking and Rating List" where this list additionally uses the volatility and statistics for creating the best and worst performer in the list from number 1 to 28.
"Comparison table" and the "Currency Score Chart"
The additional value of this table compared to the Currency Score table is that the Comparison Table compares the strength between the currencies of each pair. By subtracting the strength of the weaker currency from the stronger currency we have a way to compare each pair combination.
The comparison table provides a way to compare currencies from a longer term perspective of 13 weeks and also simultaneously taking the current trend into account. By coloring the currencies in the X and Y axis according to their Classification we can show what the best combinations are. In doing this we apply 2 rules to make it clearer.
- First of all only better classified currencies in combination with weaker classified currencies are "Approved" when there is a Currency Score difference of at least 1 in the current week.
- The only exception is when 2 currencies are similarly classified but the Currency Score difference is equal to or more than 4.
- It means that each currency should be as far apart from each other as possible in the range from 1 to 8. The classification of the currencies in question may change in the longer term. By using the difference of 4 which is exact at the half of the range it seems a safe approach for trading 2 currencies which are similarly classified.
- Even though currencies may be in the same classification a currency may be in a weaker/stronger period and may even change its classification in the future. See the current classification for the coming period at the beginning of this article.
______________________________________
Putting the pieces together
Based on the last "13 Weeks currency classification" and the "Currency Comparison Table" the most interesting currencies for going long seem to be the:
AUD, JPY and NZD.
These are strong or average currencies from a longer term perspective when looking at the last "13 Weeks currency classification".
For going short the same analysis can be done and the following currencies seem to fit best:
GBP, CAD and EUR.
These are weak or average currencies from a longer term perspective.
Currencies with a high deviation seem less interesting to trade because they are less predictable. These currencies seem to be at the moment e.g. the:
AUD and USD.
Unless these currencies offer a clear opportunity based on the longer term it seems best to be avoided. However, these currencies may offer opportunities for the short term trader.
Some of the pairs in the "Currency Comparison Table" comply for a longer term trade based on the Technical Analysis (TA) of the Daily and Weekly chart. For the coming week these seem to be: GBP/AUD, GBP/NZD, AUD/CAD and EUR/AUD.
The articles are my personal opinion, not recommendations, FX trading is risky and not suitable for everyone.The content is for educational purposes only and is aimed solely for the use by ‘experienced’ traders in the FOREX market as the contents are intended to be understood by professional users who are fully aware of the inherent risks in forex trading. The content is for 'Forex Trading Journal' purpose only. Nothing should be construed as recommendation to purchase any financial instruments. The choice and risk is always yours. Thank you.
Recommended Content
Editors’ Picks
EUR/USD holds above 1.0750 to start the week

EUR/USD trades in positive territory above 1.0750 in the European session on Monday. The US Dollar struggles to find demand following Friday's disappointing labor market data and helps the pair hold its ground.
GBP/USD edges higher toward 1.2600

Following Friday's volatile action, GBP/USD pushes higher toward 1.2600 on Monday. Soft April jobs report from the US and the modest improvement seen in risk mood make it difficult for the US Dollar to gather strength.
Gold rebounds above $2,310 after downbeat NFP data, eyes on Fedspeak

Gold price trades in positive territory above $2,310 after closing the previous week in the red. The weaker-than-expected US employment data have boosted the odds of a September Fed rate cut, hurting the USD and helping XAU/USD find support.
Addressing the crypto investor dilemma: To invest or not? Premium

Bitcoin price trades around $63,000 with no directional bias. The consolidation has pushed crypto investors into a state of uncertainty. Investors can expect a bullish directional bias above $70,000 and a bearish one below $50,000.
Week ahead: BoE and RBA decisions headline a calm week

Bank of England meets on Thursday, unlikely to signal rate cuts. Reserve Bank of Australia could maintain a higher-for-longer stance. Elsewhere, Bank of Japan releases summary of opinions.