EUR/USD
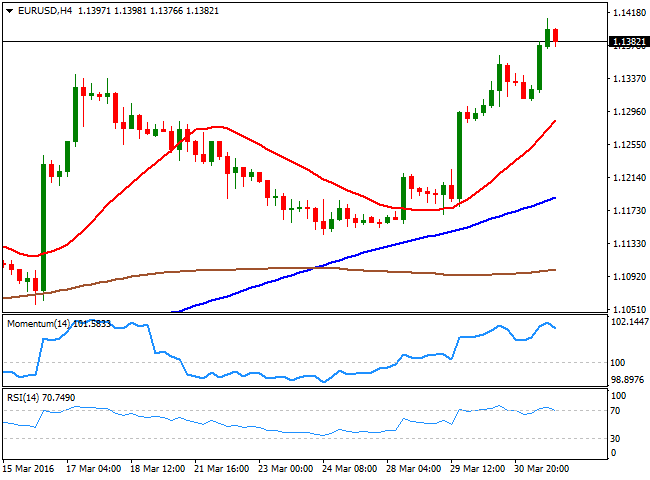
The EUR/USD pair kept rallying on Thursday, reaching a fresh year high of 1.1411, despite macroeconomic data coming from Germany was far from encouraging. According to official releases, German unemployment was unchanged in March, snapping a run of five consecutive declines, although the unemployment rate held at its record low of 6.2%. Retail Sales in the country, fell by 0.4% during February, whilst it rose 5.4% in real terms compared to a year before. Negative sentiment towards the greenback prevailed ahead of the US Nonfarm Payroll report, expected to do little to convince FED's officers on the convenience of a sooner rate hike. In the US, weekly unemployment claims in the week ending March 26 reached 276K, above expected, while the 4week moving average was 263,250, an increase of 3,500 from the previous week's unrevised average of 259,750. The Chicago PM increased to 53.6 in March, led by a recovery in production and employment. In the meantime, the 4 hours chart for the pair shows that the technical indicators have turned lower within overbought territory, as the pair has rallied with little corrections in the middle ever since the week started. Nevertheless, the RSI indicator remains above 70, and the price far above a bullish 20 SMA, as the price holds above its previous yearly high of 1.1375, all of which maintains the risk towards the upside. The pair may suffer a downward kneejerk on a very strong US report, particularly if wages surge beyond expected, but after the dust settles, speculative interest will be likely looking to buy the dips.
Support levels: 1.1365 1.1330 1.1290
Resistance levels: 1.1410 1.1460 1.1500
GBP/USD
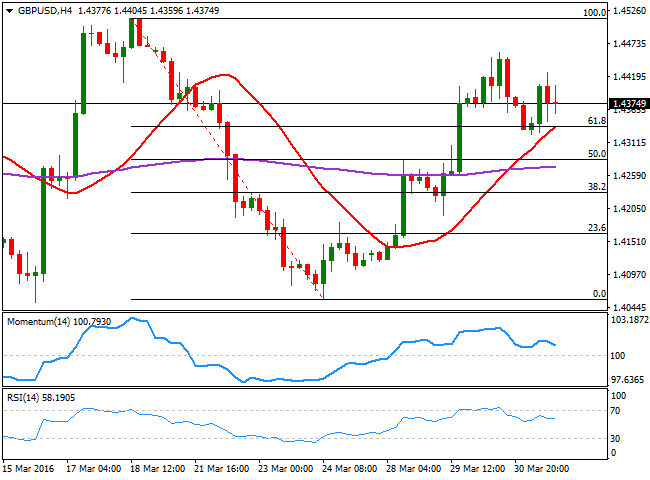
The GBP/USD pair closed the day flat, in spite of an upward revision of the local GDP and broad dollar´s weakness. Early during the London session, the UK released the final revision of its Q4 2015 GDP, up to 0.6% from a previous estimate of 0.5%, while the annual figure resulted at 2.1% from a previous 1.9%. The faster than expected growth was led by the services sector, but overall, this is old news, and had little effect over the price. At the same time, the UK released its Q4 current account, which posted a record high deficit of £32.7B. Technically, the pair has managed to hold above the 61.8% retracement of its latest decline around 1.4330, as a deep towards 1.4325 was quickly reverted. Having traded in quite a limited range for the past two sessions, the 1 hour chart presents a neutral to bullish stance, as the price holds above a horizontal 20 SMA, whilst the technical indicators hold flat within positive territory. In the 4 hours chart, the technical indicators head south within positive territory, having posted lower highs from yesterday, increasing the risk of a downward move. The immediate support comes at 1.4330, the mentioned 61.8% Fibonacci retracement and also the 20 SMA in the 4 hours chart, which reinforces the strength of the level, and therefore has more bearish implications on a break below it.
Support levels: 1.4330 1.4290 1.4250
Resistance levels: 1.4420 1.4460 1.4515
USD/JPY
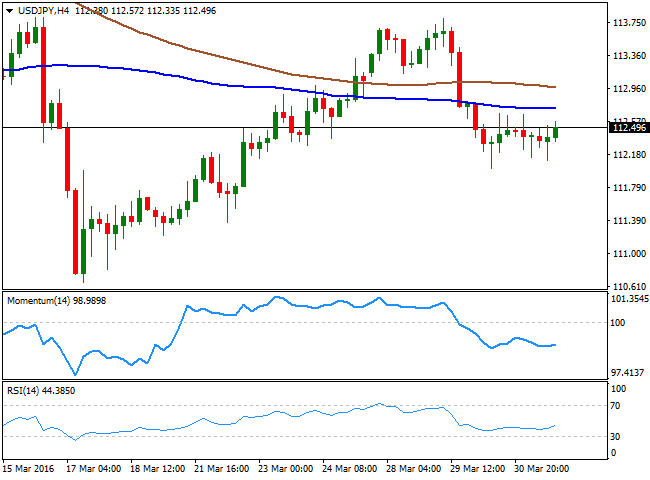
The USD/JPY pair was unmotivated this Thursday, trading in a tight 50 pips range ever since the day started. Japan will release its Tankan manufacturing data during the upcoming Asian session, expected to show a dismal decrease during the first quarter of the year. A negative reading may fuel speculation of further easing coming from the BOJ and send the pair higher, although the reaction could be limited ahead of the US monthly employment report to be released on Friday. In the meantime, the bearish trend has paused, but not reverted, and investors are still willing to push the pair towards the 110.00 region, to test BOJ's determination to keep the JPY lower. Short term, the 1 hour chart shows that the price has been unable to advance beyond its 200 SMA, the immediate resistance around 112.60. The Momentum indicator heads higher within positive territory, but the RSI indicator has turned flat around its midline, leaving little room for additional gains. In the 4 hours chart, the technical indicators have lost their bearish strength within bearish territory, but remain well below their midlines, with no certain directional strength, as the price remains below its moving averages.
Support levels: 111.90 111.50 111.00
Resistance levels: 112.60 113.10 113.35
GOLD
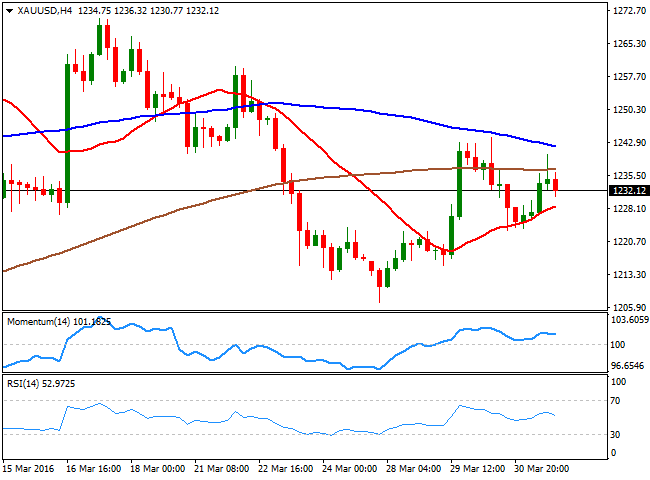
Gold prices recovered some ground on Thursday, with spot ending the day around $1,232.30 a troy ounce, helped by the soft tone in worldwide equities, as most major markets closed in the red. The bright metal traded as high as 1,240.35, retreating partially in the US session, but posting the biggest quarterly rise in almost three decades. Technically however, the upside is still seen limited, as in the daily chart the price retreated from a bearish 20 SMA, today at 1,242.35, whilst the technical indicators have posted modest advances, but remain within bearish territory. In the 4 hours chart, the price has managed to hold above a bullish 20 SMA, but the Momentum indicator heads south and approaches its midline, while the RSI indicator stands flat around 53, all of which suggests that speculators are looking for a clearer clue before resume buying.
Support levels: 1,225.00 1,213.90 1.206.90
Resistance levels: 1,242.35 1,253.75 1,264.80
WTI CRUDE
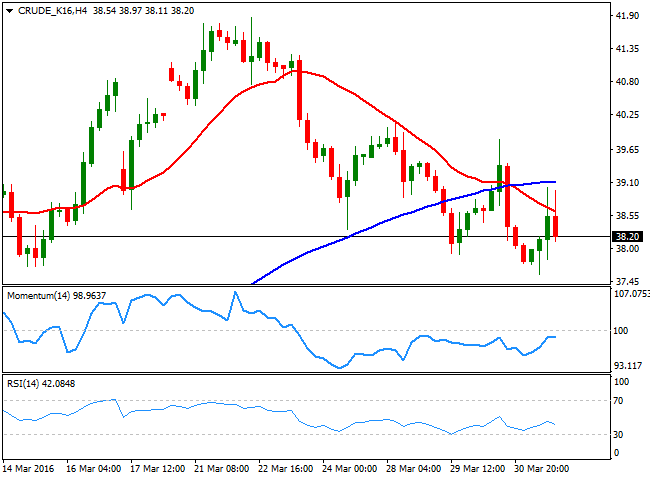
WTI crude oil futures fell to a fresh 2week low of $37.56 a barrel this Thursday, but ended the day in positive ground, a few cents above the 38.00 level. The commodity gained on dollar's weakness, but the advance was capped by persistent concerns over a worldwide glut, after the US reported a large increase in its stockpiles last Wednesday. Also, weighing on crude oil prices were Saudi Arabia and Kuwait announced that they would be reopening the jointly operated Khafji field, which will produce around 300K barrels a day. The daily recovery was not enough to send the price above its 20 DMA, now acting as a dynamic resistance around 38.90. In the daily chart, the technical indicators have bounced from their midlines, but the shallow slopes suggest no upward momentum. In the shorter term, the 4 hours chart shows that the price is also below its 20 SMA, while the RSI indicator heads south around 42, supporting some further slides for this Friday.
Support levels: 37.90 37.40 36.80
Resistance levels: 38.90 39.60 40.15
DAX
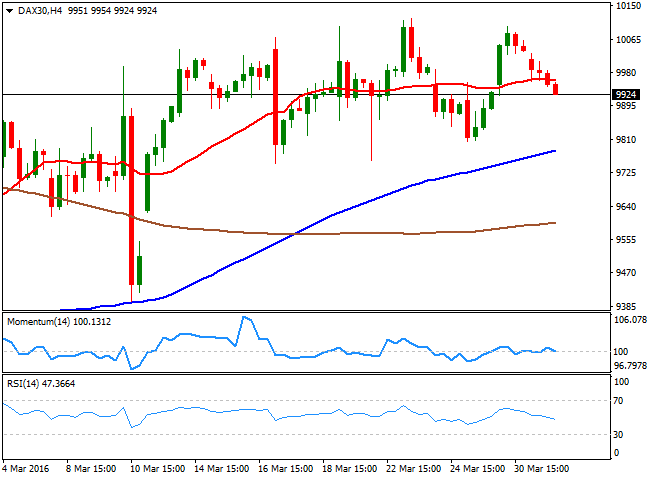
The German DAX gave back its latest gains, closing 0.81% lower at 9,965.51, as mixed German data failed to boost confidence in the EU largest economy. In general, European equities closed in the red, weighed by the release of the region inflation figures for March, showing that it's still in deflationary territory down by 0.1% compared to the previous month. The benchmark extended its decline below Wednesday's low in after hours trading, point to extend its decline further this Friday. In the daily chart, the 20 SMA has turned flat around 9,871, now the immediate support, while the technical indicators turned lower and are currently within neutral territory. In the 4 hours chart, the index keeps lacking clear directional strength, with the 20 SMA now horizontal a few points above the current level, the Momentum indicator stuck around its 100 line, and the RSI indicator heading lower around 47, pointing for some additional declines this Friday.
Support levels: 9,911 9,835 9,762
Resistance levels: 9,985 10,040 10,118
DOW JONES
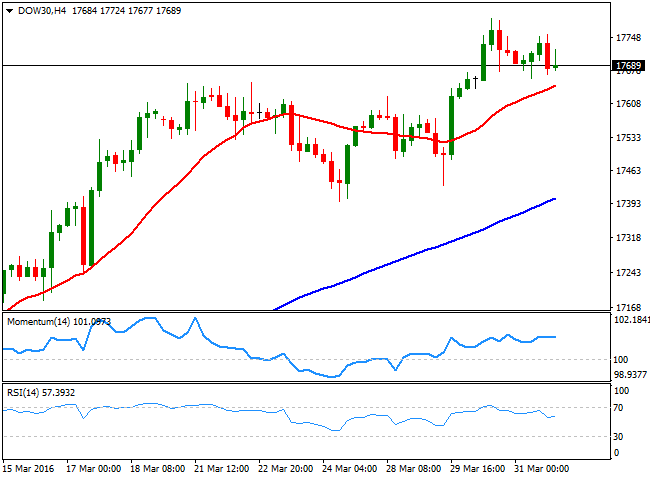
Wall Street ended up mixed, as the post Yellen euphoria receded, and investors preferred to book profits ahead of the US Nonfarm Payrolls report. The Nasdaq was pretty much flat, up 0.01% to end at 4,869.85, while the S and P lost 4 points to close at 2,059.74 and the DJIA shed 31 points, closing the day marginally lower at 17,685.09. But monthly basis, all of the three index closed with solid gains, up between 6.6% and 7.1% the best month since last October. As for the DJIA technical picture, the daily decline was not enough to affect the dominant bullish trend, and seems more as a downward corrective move than the announcement of a downward extension. In the daily chart, the Momentum indicator is starting to draw a bearish divergence, but it still needs to break below its 100 level to confirm it. In the same chart, the 20 SMA has extended further its advance below the current level, while the RSI indicator remains in overbought territory, favoring further gains ahead. In the 4 hours chart, the technical picture is neutral to bullish, as the index is a few points above a mild bullish 20 SMA, while the technical indicators head nowhere, but well above their midlines.
Support levels: 17,652 17,581 17,502
Resistance levels: 17,724 17,790 17,865
FTSE 100
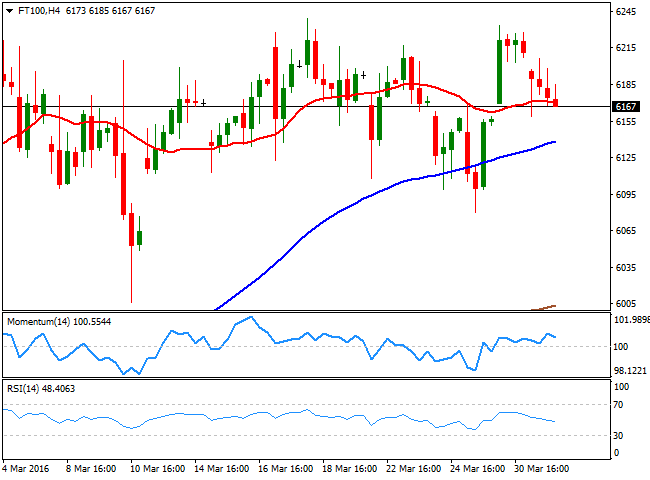
The FTSE 100 lost 28 points on Thursday and closed the day at 6,174.90, weighed by a slide in oil and utility related shares. Royal Dutch Shell lost 0.8% while BP closed 1.5% lower, while mining companies were affected by a fall in copper prices, down to a 4week low. The index holds within its latest range, trapped between the 100 DMA, at 6,083 and the 200 DMA at 6,251 for over two weeks. Also in the daily chart, the Momentum indicator holds flat around its midline, while the RSI indicator lacks directional strength and holds around 54, giving no clear clues on what's next for the index. In the 4 hours chart, the pair maintains the neutral stance seen on previous updates, as the benchmark continues hovering around a horizontal 20 SMA, the Momentum indicator heads nowhere around the 100 level, and the RSI indicator heads south around 48.
Support levels: 6,112 6,087 6,006
Resistance levels: 6,185 6,239 6,268
The information set forth herein was obtained from sources which we believe to be reliable, but its accuracy cannot be guaranteed. It is not intended to be an offer, or the solicitation of any offer, to buy or sell the products or instruments referred herein. Any person placing reliance on this commentary to undertake trading does so entirely at their own risk.
Recommended Content
Editors’ Picks
AUD/USD extends gains due to improved risk appetite

The Australian Dollar maintained its winning streak for the fourth consecutive session on Monday, buoyed by a hawkish sentiment surrounding the Reserve Bank of Australia. This optimism bolsters the strength of the Aussie Dollar, providing support to the AUD/USD pair.
USD/JPY snaps three-day losing streak above 153.50, Yellen counsels caution on currency intervention

The USD/JPY pair snap a three-day losing streak during the Asian trading hours on Monday. The uptick of the pair is bolstered by the modest rebound of the US Dollar and US Treasury Secretary Janet Yellen’s comments on potential Japanese interventions last week.
Gold price rebounds on downbeat NFP data, softer US Dollar

Gold price snaps the two-day losing streak during the Asian session on Monday. The weaker-than-expected US employment reports have boosted the odds of a September rate cut from the US Federal Reserve. This, in turn, has dragged the US Dollar lower and lifted the USD-denominated gold.
Bitcoin Cash could become a Cardano partnerchain as 66% of 11.3K voters say “Aye”

Bitcoin Cash is the current mania in the Cardano ecosystem following a proposal by the network’s executive inviting the public to vote on X, about a possible integration.
Week ahead: BoE and RBA decisions headline a calm week

Bank of England meets on Thursday, unlikely to signal rate cuts. Reserve Bank of Australia could maintain a higher-for-longer stance. Elsewhere, Bank of Japan releases summary of opinions.
