EUR/USD
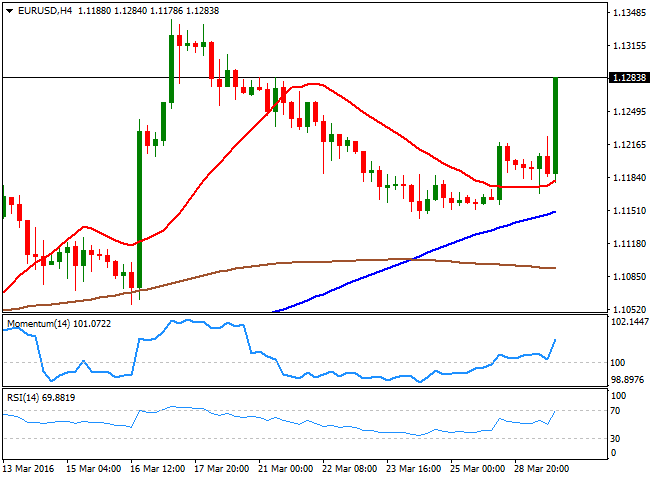
FED's Yellen smashed the greenback in its speech at the Economic Club of New York, in where she reiterated its previous ultradovish stance when it comes to the US economic policy. Among other things, the FED Chair mentioned that they must proceed with caution with rate hikes and regarding inflation, explained that it is too early to see if the recent pickup in core inflation “will prove durable.” Also, she added that the FED has "considerable scope for stimulus if needed," erasing any chance of a rate hike at least until September. Janet Yellen sealed dollar's destiny, and sent the EUR/USD pair up to the 1.1300 region, trespassing last week´s high, and therefore indicating a strong upward potential for the upcoming sessions. A rate hike in the US is now is unlikely until at least September, and the dollar will pay the price, probably by sinking further across the board. As for the technical picture of the pair, the 4 hours chart shows that the technical indicators are entering overbought territory by the end of the US session, as the price remains pressuring the highs, all of which supports a continued advance towards the 1.1340 level, this month high, en route to 1.1375, the year high. Should the price extend beyond this last, the rally can extend up to 1.1460, a major static resistance level that contained the pair since early 2015.
Support levels: 1.1245 1.1190 1.1140
Resistance levels: 1.1340 1.1375 1.1420
GBP/USD
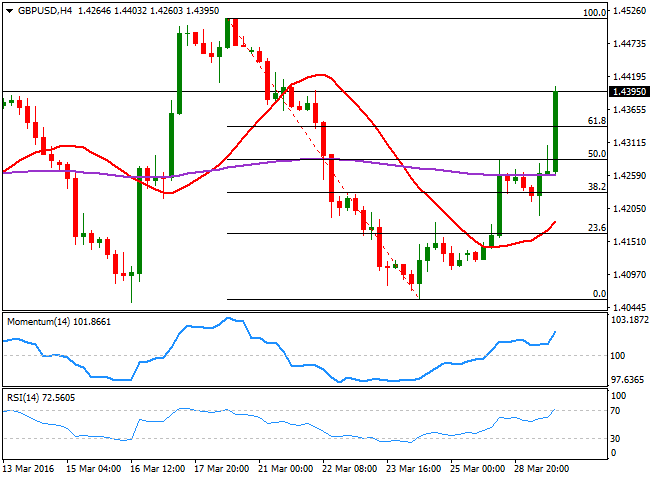
The GBP/USD pair rallied this Tuesday up to 1.4403, the highest for the week on broad dollar's weakness, albeit the advance began earlier in the day, with no actual catalyst beyond the movement, but some follow through of Monday's gains. The pair traded as low as 1.4193 at the beginning of the London session, from where a sharp bounce was triggered, in spite of BOE's Financial Stability Report saying that the economy's outlook has worsened since it last report in November. That early bounce suggests that Brexit's fears have, somehow diminished, and that the Sterling may keep rallying, particularly now that the market is determinate to sell the greenback. The 4 hours chart shows that the price is back above its 200 EMA, which provided support ever since the US session started, whilst the technical indicators maintain strong bullish slopes near overbought levels, supporting a retest of this March high at 1.4513.
Support levels: 1.4335 1.4290 1.4250
Resistance levels: 1.4410 1.4460 1.4515
USD/JPY
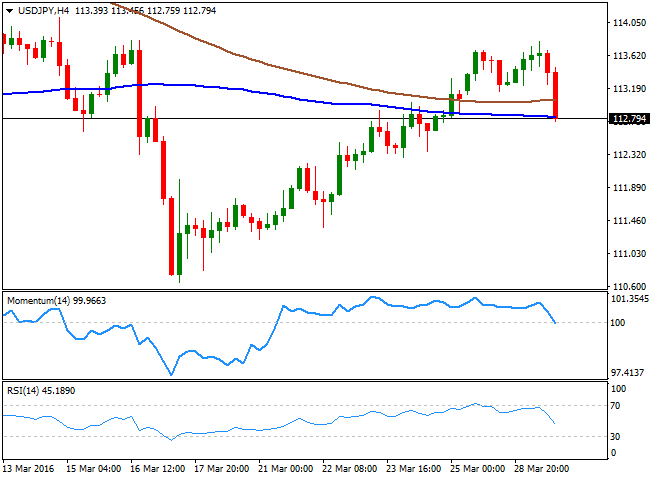
After posting a fresh two week high of 113.79, the USD/JPY pair plunged over 100 pips, as FED's Yellen down talked the possibility of a soon to come rate hike in the US. The Japanese yen was hit during Asian hours, as local retail sales fell a whopping 2.3% in February, while the unemployment rate during the same month surged to 3.3%, above the 3.2% expected. Also, and alongside with the approval of the budget for FY2016 in the upper house, PM Abe said that he is not intending to delay the planned sales tax, given that the economic fundamentals for the country are sound. The USD/JPY pair in its hourly chart, is now presenting a strong bearish tone, given that the technical indicators keep heading south, despite being in oversold territory, while the price has broken below its 100 SMA, now the immediate resistance around 113.05. In the 4 hours chart, the price has extended below its 100 and 200 SMAs, whilst the technical indicators are currently crossing below their midlines almost vertically, indicating further slides are yet to be seen.
Support levels: 112.40 111.90 111.50
Resistance levels: 113.05 113.35 113.70
GOLD
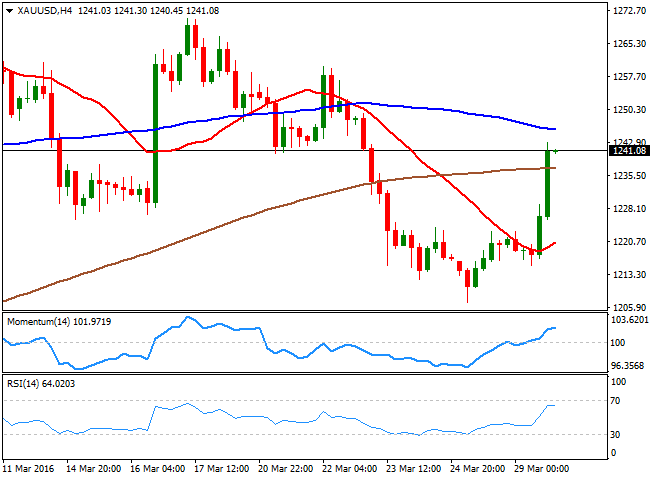
Gold prices turned higher ahead of Yellen's speech, as stocks traded softly, generating some safehaven demand. Spot gold erased most of its latest losses and rallied up to $1,242.98, as a rate hike in the US is now out of the table, as she made it clear that she wants to go slow when it comes to hiking interest rates. Now holding around 1,240.00, the commodity has accelerated its advance after triggering stops above 1,225.00 now a major support. Daily basis, the recovery is still below a bearish 20 SMA, currently at 1,246,00, while the technical indicators have turned north, but remain within negative territory, all of which is not enough to confirm further gains. In the 4 hours chart, the commodity is well above a now bullish 20 SMA, while the technical indicators have turned slightly lower near overbought readings, rather signaling some consolidation than a downward move during the upcoming hours.
Support levels: 1,236.10 1,225.00 1,213.90
Resistance levels: 1,246.00 1,253.75 1,260.30
WTI CRUDE
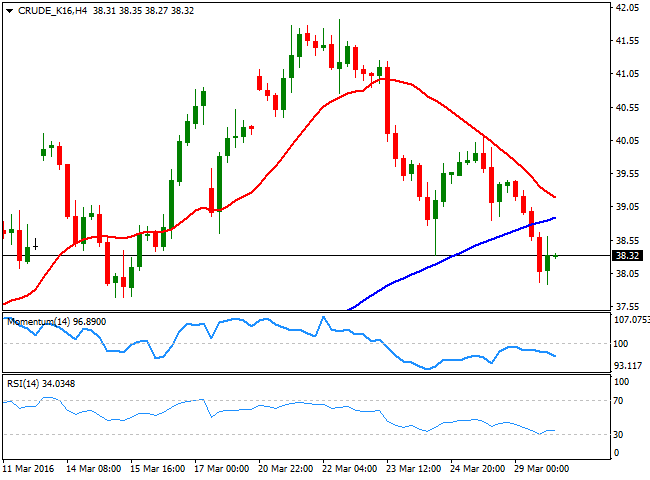
Crude oil prices kept fading this Tuesday, with WTI futures falling down to $37.89 a barrel, the lowest in two weeks, on news reporting that Iran will likely attend the upcoming oil producers' meeting in Doha, but won't join the freezing output, as the country still wants to regain market share. The black gold pared losses on FED Yellen's comments, but closed around Friday's low, and below its daily 20 SMA, for the first time since February 12th. The technical indicators in the mentioned time frame have extended their declines and are about to cross their midlines towards, the downside, one step away from confirming a bearish breakout. Shorter term, the technical picture also favors the downside, given that the price is currently below a bearish 20 SMA, capping the upside now around 39.20, whilst the Momentum indicator turned slightly lower below its 100 level, and the RSI aims higher around 37, tracking the bounce from the daily low rather than supporting a continued advance.
Support levels: 37.90 37.40 36.80
Resistance levels: 39.20 39.90 40.40
DAX
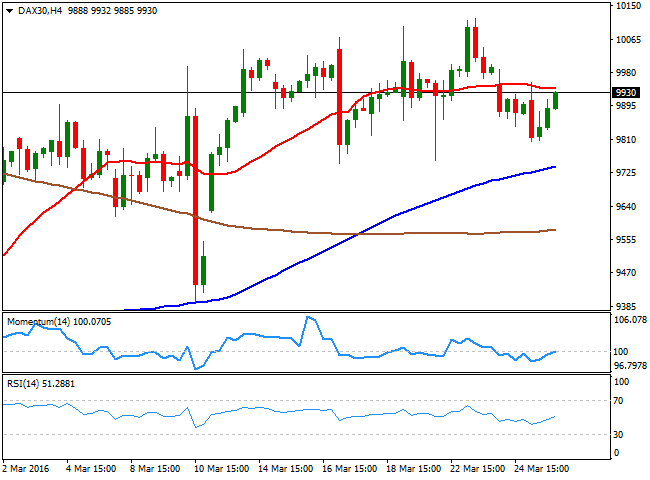
European equities posted a modest come back after the long weekend, opening higher, but then falling into the red, where they stood for most of the day. The German DAX closed the day at 9,887.94, up by 36 points, weighed by commodity related stocks, down on oil's slide. The benchmark recovered some ground in electronic trading, following the strong advance in US indexes, but remains below the critical 10,000 level ahead of the Asian opening. Technically, the daily chart shows that an early decline extended briefly below a still bullish 20 SMA, whilst the technical indicators have turned slightly higher above their midlines, lacking strength enough to confirm further gains. In the 4 hours chart, the index is right below a horizontal 20 SMA, currently at 9,940 and the immediate resistance, while the technical indicators are losing upward strength around their midlines, indicating that there's no buying interest at current levels.
Support levels: 9,932 9,842 9,774
Resistance levels: 9,940 10,010 10,118
DOW JONES
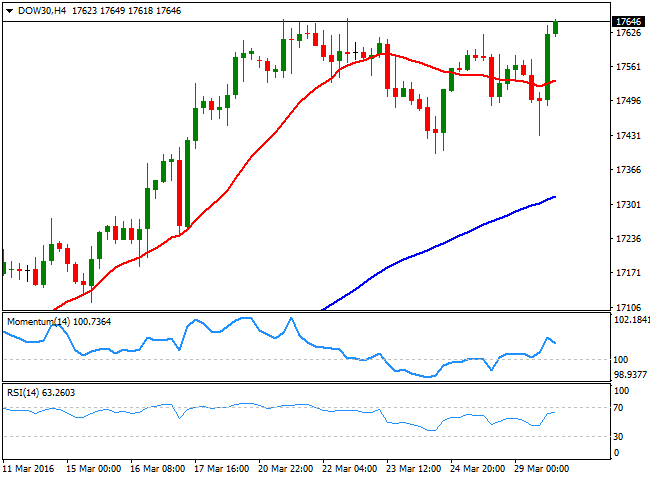
US stocks cheered Yellen's dovish tone, and the DJIA closed at its highest for this 2016, at 17,633.11 up by 97 points. The Nasdaq added 1.67% to end at 4,846.62, while the SandP rose by 17 points, and closed the day at 2,055.01. Bond yields fell, with the 10y Treasury note offering its lowest in a month, settling at 1.81%, down from 1.87% on Monday. Tech stocks led the way higher, with Apple up 2.4% neutralizing the soft tone in commodity linked shares. The daily chart for the DJIA shows that the index remains within its daily high after the close, extending its rally well above its moving averages, and with the RSI indicator turning higher, despite being in overbought territory. The Momentum indicator in the mentioned time frame, however, still lags, heading south within positive territory, but far from suggesting a downward move. In the shorter term, the 4 hours chart, shows that the index is above a still flat 20 SMA, while the technical indicators have turned slightly lower, but remain above their midlines, rather reflecting the lack of volume after the close than suggesting upward exhaustion.
Support levels: 17,502 17,440 17,396
Resistance levels: 17,581 17,652 17,728
FTSE 100
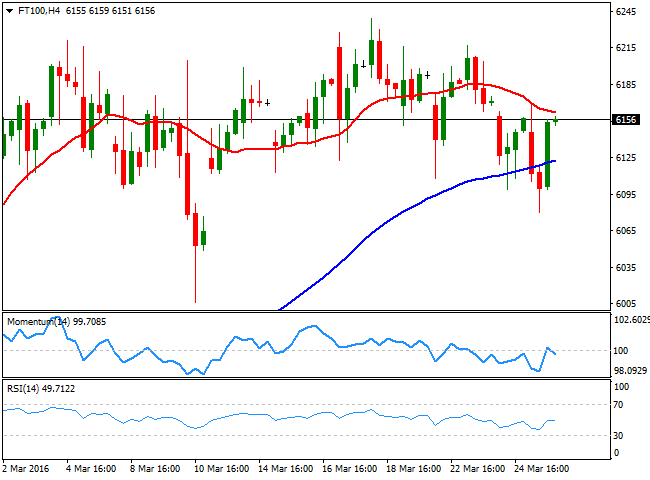
Despite opening higher, the Footsie closed flat at 6,105.90, as investors were in cautious mode ahead of Yellen, while lower oil prices weighed on commodity related shares. Mining related shares saw the biggest losses, with Glencore down 4.9% and Anglo American dropping 4.3%. The index saw a tepid advance in after hours trading, but the daily chart shows that it was not enough to revert the negative tone in the technical indicators, still heading slightly lower within neutral territory. In the same, chart, the index is right below a bullish 20 DMA, whilst the daily low converges with the 100 DMA, this last at 6,087, providing a strong dynamic support. In the 4 hours chart, the risk remains towards the downside, as the index met intraday selling interest around on approaches to its 20 SMA, still above the current revel, while the technical indicators reached their midlines from below, but failed to extend beyond them and are currently retreating.
Support levels: 6,112 6,075 6,037
Resistance levels: 6,239 6,268 6,326
The information set forth herein was obtained from sources which we believe to be reliable, but its accuracy cannot be guaranteed. It is not intended to be an offer, or the solicitation of any offer, to buy or sell the products or instruments referred herein. Any person placing reliance on this commentary to undertake trading does so entirely at their own risk.
Recommended Content
Editors’ Picks
EUR/USD hovers near 1.0700 ahead of US data

EUR/USD struggles to build on Wednesday's gains and fluctuates in a tight channel near 1.0700 on Thursday. The US Dollar holds its ground following the Fed-inspired decline as market focus shifts to mid-tier US data releases.
GBP/USD holds steady above 1.2500 following Wednesday's rebound

GBP/USD stays in a consolidation phase slightly above 1.2500 on Thursday after closing in the green on Wednesday. A mixed market mood caps the GBP/USD upside ahead of Unit Labor Costs and Jobless Claims data from the US.
Gold retreats to $2,300 despite falling US yields

Gold stays under bearish pressure and trades deep in negative territory at around $2,300 on Thursday. The benchmark 10-year US Treasury bond edges lower following the Fed's policy decisions but XAU/USD struggles to find a foothold.
Top 3 Price Prediction BTC, ETH, XRP: Altcoins to pump once BTC bottoms out, slow grind up for now

Bitcoin reclaiming above $59,200 would hint that BTC has already bottomed out, setting the tone for a run north. Ethereum holding above $2,900 keeps a bullish reversal pattern viable despite falling momentum. Ripple coils up for a move north as XRP bulls defend $0.5000.
Happy Apple day

Apple is due to report Q1 results today after the bell. Expectations are soft given that Apple’s Chinese business got a major hit in Q1 as competitors increased their market share against the giant Apple.
