EUR/USD
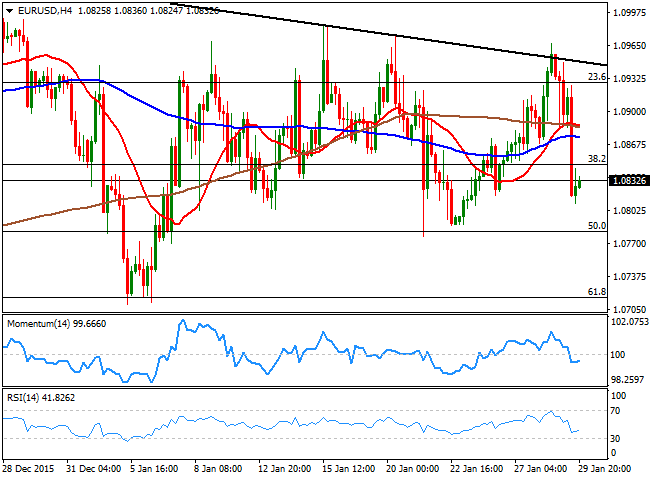
The Bank of Japan sealed currencies' fate on Friday, by introducing negative rates, announcing a 0.10% interest rate on current accounts that financial institutions hold at the BOJ. The American dollar surged again most of its rivals, although gains were limited by tepid local data. The US Q4 advanced GDP came in with a small downside surprise, as it showed the economy grew by 0.7% against the 0.8% expected. The slowdown in the US by the end of 2015 was already anticipated by the FED last Wednesday, and it seems that market's players had priced in an even lower reading ahead of the release, given that the currency gained sharply after the announcement. The rally, however, stalled with the release of the final Michigan sentiment index that declined to 92.0 during January.The EUR/USD pair closed the week at 1.0832 after being rejected by a daily descendant trend line in an advance up to 1.0967, a zone in where the pair had met selling interest several times over the past January. Holding near the base of its range, the pair continues lacking long term definitions, as it has been trapped for over a month in a 200 pips' range. Short term the 4 hours chart maintains the risk towards the downside, given that the technical indicators are standing below their midlines, and the price below the moving averages. The immediate resistance for this Monday comes at 1.0845, a Fibonacci level, while the main support is the 1.0770/800 region.
Support levels: 1.0810 1.0770 1.0730
Resistance levels: 1.0845 1.0890 1.0925
GBP/USD
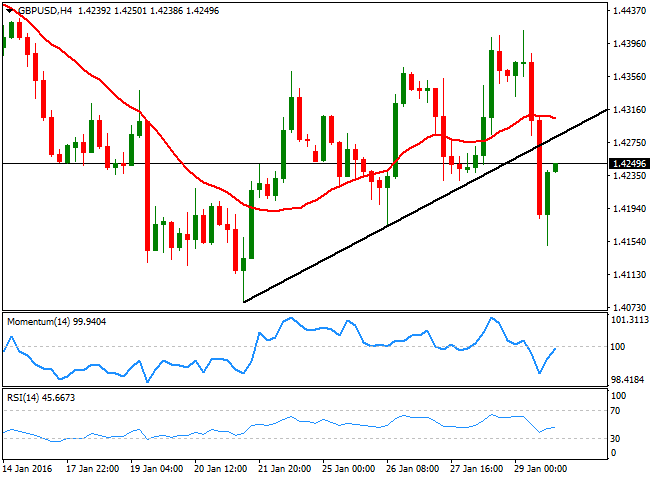
The GBP/USD pair closed the week flat around 1.4250, having set a high of 1.4412 earlier this week. The Pound however, was unable to hold to early week gains as the background weakness remains firm in place, as expectations of a UK rate hike have been steadily decreasing since late 2015. During this upcoming days, the BOE will have its monthly economic policy meeting, expected to remain as a nonevent, particularly after BOE Governor, Mark Carney, said that “now is not yet the time to raise interest rates.” The pair started the week with a positive tone, but gains where moderated by the negative sentiment towards the British currency that is set to extend this February. Anyway, and from a technical point of view, the downward potential has grown after the pair broke below a daily ascendant trend line, currently offering an immediate short term resistance at 1.4280. Should the pair complete a pullback to the level, but fail to extend above it, the downward potential will increase. In the 4 hours chart the technical indicators have bounced from oversold readings but remain within negative territory while the 20 SMA holds around 1.4310, capping the upside.
Support levels: 1.4220 1.4180 1.4135
Resistance levels: 1.4280 1.4310 1.4360
USD/JPY
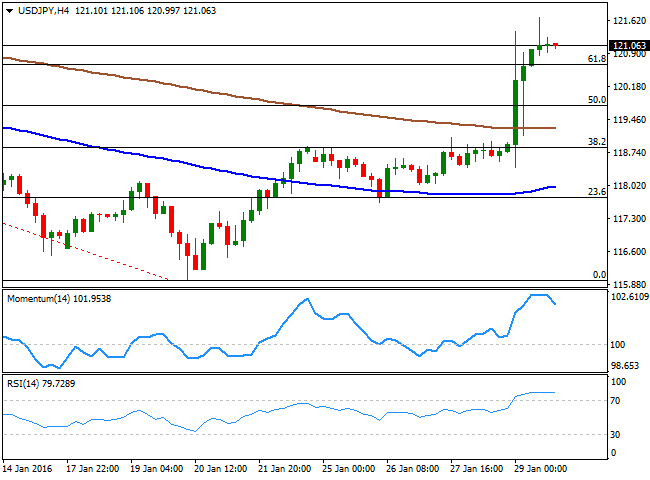
The USD/JPY pair soared during the Asian session, establishing a fresh monthly high of 121.68, underpinned by a JPY selloff after the BOJ announced fresh stimulus measures. The Bank of Japan not only cut to 0.10% the interbank rate, but also cut its inflation forecast for the fiscal year that begins April 1 to 0.8% from 1.4%. Also, it pushed out to the beginning of the 2017 fiscal year the date when it will reach its 2% inflation target. The pair surged almost 300 pips, and held to most of its gains by the end of the day, closing the week at 121.06. The short term technical picture suggests some consolidation ahead, given that the technical indicators in the 1 hour chart have retreated sharply from overbought levels, but the price remained near its highs. In the 4 hours chart the technical indicators are giving signs of upward exhaustion in extreme overbought territory, yet remain far from suggesting a downward movement, in line with the shorter term perspective. The pair has advanced beyond the 61.8% retracement of the latest daily fall around 120.60. As long as the level holds, bulls will retain control of the pair, with a break above 121.70 opening doors for an advance up to the 123.50 region where the pair will complete a 100% retracement.
Support levels: 120.60 120.15 119.70
Resistance levels: 121.30 121.70 122.10
GOLD
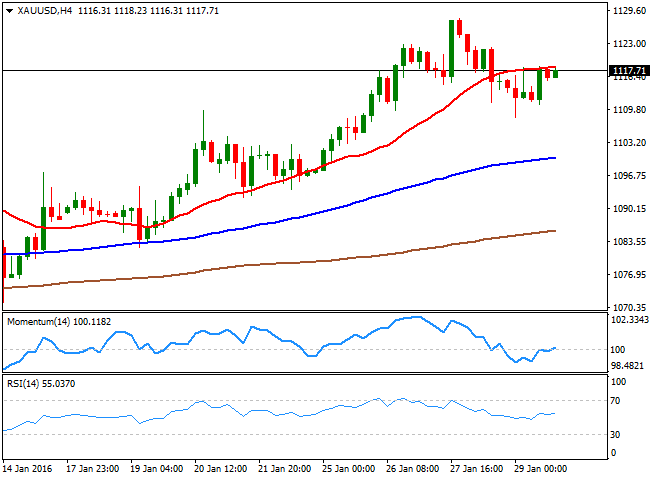
Gold prices fell early Friday, after BOJ's decision to cut to minus 0.1 % the benchmark rate that applies to deposits by lenders with the central bank. Spot gold fell down to $1108.35 a troy ounce, from where it bounced to close in the green, at 1,117.71. The commodity had its best monthly gain in dollar terms since January 2015, and while it is still unclear where the precious metal will head from here, recent behavior suggests that an interim bottom has been set and higher highs are likely in the midterm. Technically and according to the daily chart, the upward potential is limited, given that the RSI indicator heads higher around the 62 level and the price holds well above its 20 and 100 SMAs, but the 200 SMA caps the upside, while the Momentum indicator has partially lost strength, and turned lower within positive territory. In the 4 hours chart, the price is struggling around its 20 SMA, while the technical indicators aim higher within neutral territory, lacking directional strength at the time being.
Support levels: 1,115.70 1,109.60 1,100.20
Resistance levels: 1,122.10 1,127.60 1,134.90
WTI CRUDE
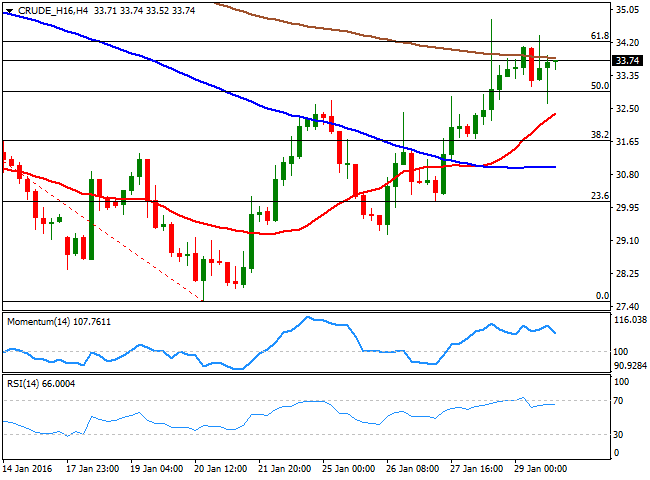
West Texas Intermediate crude oil futures ended a second week inarow with gains at $33.74 a barrel, having been as high as 34.80, the high set last Thursday, when Russian Energy Minister Alexander Novak said that there was a proposal of a meeting between Organization of the Petroleum Exporting Countries (OPEC) members and nonOPEC countries, to reduce oil production. The comment was denied by Saudi Arabia, but the commodity held into gains. On Sunday, Al Arabiya television reported that Saudi Arabia wants to cooperate with other oil producers to support the oil market, which may lead to some additional gains in the commodity at the start of the week. The technical picture supports the bullish case, as in the daily chart, the price has advanced above its 20 SMA for the first time in over a month, while the technical indicators remain well above their midlines, although they have lost upward strength. In the 4 hours chart, the technical indicators are retreating from overbought territory, far from suggesting a bearish move, while the 20 SMA retains a sharp bullish slope below the current price, in line with another leg higher on an advance beyond 34.30, the 61.8% retracement of the latest daily decline.
Support levels: 32.95 32.20 31.50
Resistance levels: 34.30 35.10 36.00
DAX
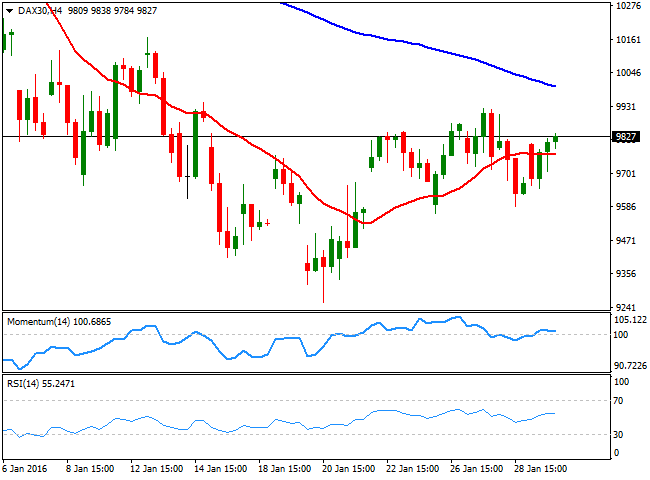
European equities closed sharply higher on Friday, following the Bank of Japan's surprise announcement of adopting negative interest rates for the first time. The German DAX recovered its previous losses and closed the day 1.64% higher at 9.798.11, with banks reversing its Thursday's losses. Among worldwide indexes, the DAX is the one looking weaker, as in the daily chart the rally stalled around a strongly bearish 20 SMA, while the Momentum indicator turned flat right below its 100 level, and the RSI indicator remains within bearish territory, around 46. Shorter term the 4 hours chart shows that the benchmark stands a few points above a horizontal 20 SMA, while the technical indicators are turning lower around their midlines, indicating little buying interest around the current level.
Support levels: 9,784 9,712 9,648
Resistance levels: 9,712 9,782 9,870
DOW JONES
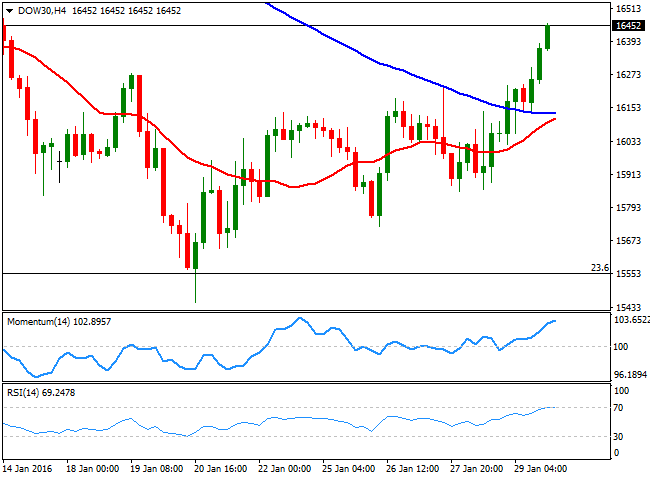
Wall Street advanced strongly on Friday, supported by the BOJ's announcement of cutting rates into negative territory, but closed the month in the red, posting the worst January since 2009. The DJIA ended up 396 points at 16,466.30, while the Nasdaq and the SandP added over 2% each. Stocks rallied on speculation that the FED will have to keep interest rates lower for longer, as one more Central Bank jumped into the easing path, whilst growth in the US has decelerated by the end of 2015, according to the Q4 Advanced GDP figure. The daily chart for the DJIA shows that the index has extended sharply above a still bearish 20 SMA, and that the technical indicators head sharply higher above their midlines, in line with further advances. In the shorter term, the 4 hours chart shows that the index closed near its daily high and well above the 20 and 100 SMAs, while the technical indicators have partially lost upward strength near overbought levels, albeit far from suggesting the rally is exhausted. The index has an immediate resistance at 16,476, January 14th daily high, the level to support an upward continuation this Monday.
Support levels: 16,387 16,310 16,240
Resistance levels: 16,476 16,545 16,619
FTSE 100
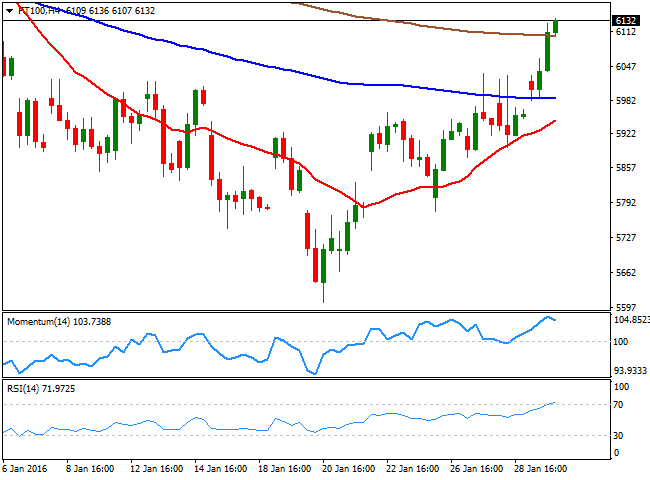
The London benchmark, the FTSE 100 added 155 points last Friday to close at 6,083.79, extending afterhours to a fresh 3week high of 6,136, and holding nearby by the end of the day. The Footsie was underpinned by strong earnings reports, with Sky up 3.94% after the broadcaster reported operating profit, of £747 million, higher than a consensus forecast of £727 million. The index, however, finished the month in the red, but the daily chart supports a bullish case given that it has extended further above its 20 SMA, while the technical indicators head sharply higher above their midlines, for the first time in over a month. In the 4 hours chart, the index is well above its moving averages, with the 20 SMA heading north around 5,945 while the technical indicators have lost their upward strength, but remain within overbought territory.
Support levels: 6,107 6,042 5,983
Resistance levels: 6,169 6,210 6,268
The information set forth herein was obtained from sources which we believe to be reliable, but its accuracy cannot be guaranteed. It is not intended to be an offer, or the solicitation of any offer, to buy or sell the products or instruments referred herein. Any person placing reliance on this commentary to undertake trading does so entirely at their own risk.
Recommended Content
Editors’ Picks
AUD/USD tests lows near 0.6550 after dismal Aussie Retail Sales, mixed China's PMIs

AUD/USD is testing lows near 0.6550 after Australian Retail Sales dropped by 0.4% in March while China's NBS April PMI data came in mixed. Upbeat China's Caixin Manufacturing PMI data fails to lift the Aussie Dollar amid a softer risk tone and the US Dollar rebound.
USD/JPY rebounds to 157.00 after Monday's suspected intervention-led crash

USD/JPY is trading close to 157.00, staging a solid rebound in the Asian session on Tuesday. The pair reverses a part of heavy losses incurred on Monday after the Japanese Yen rallied hard on probable FX market intervention by Japan's authorities. Poor Japan's jobs and Retail Sales data weigh on the Yen.
Gold prices soften as traders gear up for Fed monetary policy decision

Gold price snaps two days of gains, yet it remains within familiar levels, with traders bracing for the US Fed's monetary policy decision on May 1. The XAU/USD retreats below the daily open and trades at $2,334, down 0.11%, courtesy of an improvement in risk appetite.
BNB price risks a 10% drop as Binance founder and ex-CEO Changpeng Zhao eyes Tuesday sentencing

Binance Coin price is dumping, with the one-day chart showing a defined downtrend. While the broader market continues to bleed, things could get worse for BNB price ahead of Binance executive Changpeng Zhao sentencing on Tuesday, April 30.
FX market still on intervention watch

Asian foreign exchange traders will be particularly attentive to any signs of Japanese intervention on Tuesday, following reports of Tokyo's involvement in the market on Monday. This intervention action propelled the yen upward from its 34-year low of 160 per dollar, setting off shockwaves of volatility.
