Eurozone and the United States: Where does inflation come from?
According to the latest data, inflation in both the euro area and the US is mainly driven by its core component and thus, at first glance, by demand. Supply factors are also at work through the spillover effects of the shock on energy and commodity prices and food inflation. These first-round effects show first signs of fading, which should pull inflation down more sharply in the coming months. Wage dynamics are closely monitored given their inflationary nature, which is modest but persistent, justifying the monetary response.
How much is current inflation (still) supply-side driven? How much is it due to excess demand? There is no easy answer, with the underlying question about the need for monetary tightening, its continuation, and the risk that central bankers will overtighten if inflation is more supply-led than demand-led.
What does the simple analysis of the breakdown of inflation according to its main items tell us? In the euro area, inflation could be regarded, at first glance, as essentially supply-side driven given the prevailing role played by the energy component at the beginning (chart 1). Indeed, from April to July 2021, this component explained up to 60% of headline inflation. Its relative contribution then declined as the first-round effects of this shock spread to the other components of the consumer price index (CPI), food inflation surged (which can also be related to a supply shock), and core inflation rose, an apparent sign of demand-led inflation.
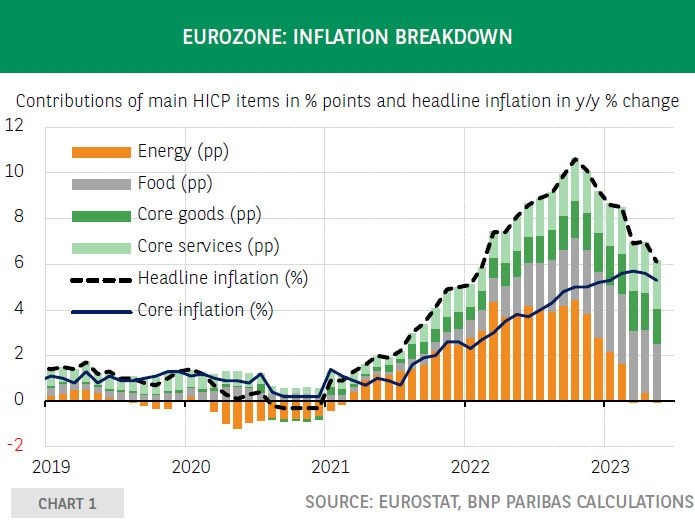
A simple relative distortion of prices at the outset, inflation then really came back, in the sense of broad-based, sustainable, and self-sustaining price increases, which is its definition. Today, with energy prices lower than a year ago, the direct contribution to inflation of this component of the CPI has vanished, pushing the headline down. In view of the sharp decline in our indicator of inflationary pressures (which combines the input prices, output prices and delivery times components of the manufacturing PMI), a larger decline in inflation over the coming months seems likely (chart 3). Inflation is nonetheless still very high (6.1% y/y in May, according to Eurostat’s flash estimate). Food inflation (12.5% y/y) explains 40% of that figure and core inflation (5.3% y/y) 60%, making inflation more persistent. From these figures alone, euro area inflation appears now driven mainly by demand.

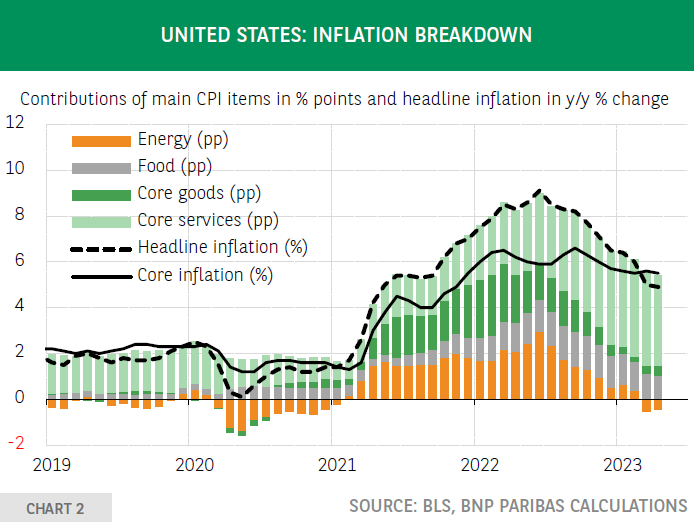
In the United States, the dynamics are different, with inflation apparently less supply-driven than demand-driven (chart 2). The energy component explained a maximum of 35% of US inflation (in April 2021, according to the CPI). The contribution of core inflation has been dominant from the beginning. At its lowest in June 2022, it still accounted for just over half of inflation (33% for energy, 15% for food). Today, thanks to the fall in the contribution of the energy component, the crossing curves of headline and core inflation is noteworthy. In March, headline inflation had been below core inflation for the first time since the end of 2020. As in the euro area, it is to be hoped that the inflationary process is coming to a halt in the United States, thanks to the gradual fading of first-round inflationary effects due to rising commodity prices. Another encouraging news from the US is that inflation persistence declined significantly in April, according to the latest analysis by the New York Federal Reserve.
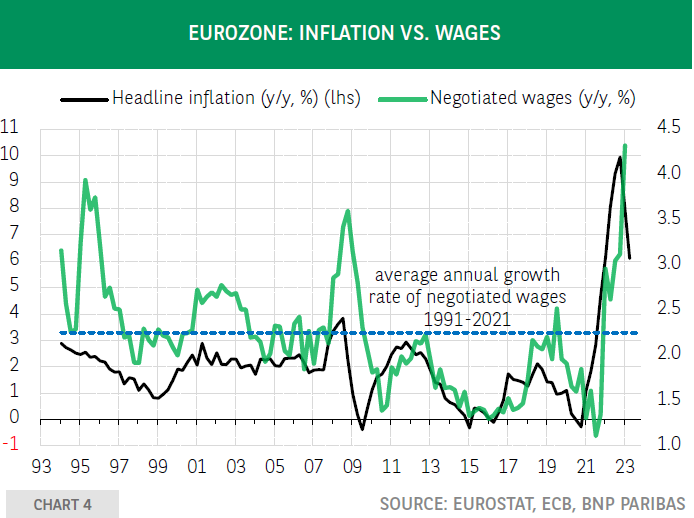
The Institute of International Finance (IIF), on the other hand, evaluates that inflation in the euro area is still essentially driven by supply because its surge has been uniform across euro area countries despite significant differences in output gap]. A diagnosis reinforced, again according to the IIF, by weaker wages dynamics in the so-called peripheral countries of the euro area, and which makes it possible to put into perspective fears of a price-wage loop. The strong increase in the ECB’s negotiated wages indicator (+4.3% y/y in Q1 2023, Figure 4) is to be closely monitored given the role of wages in the formation and dynamics of services prices and thus in the inertia of inflation.
A chart presented by Philip Lane sheds interesting light on this role of wages compared to the one played by energy prices. It distinguishes between three types of core inflation: “energy-sensitive”, “wage-sensitive”, and “not energy-sensitive”. “Energy-sensitive” core inflation remains significantly higher than “wage-sensitive” core inflation (respectively around 7% and 5% y/y in April 2023). Encouragingly, both types of inflation are showing signs of stabilisation. “Not energy sensitive” core inflation is just over 4% y/y, and in April it fell slightly, another encouraging news. This inflationary role of supply-side effects related to energy prices can be found in Bernanke and Blanchard’s (2023) recent analysis of the origin of post-pandemic US inflation. According to the authors, US inflation is not primarily driven by an overheating labour market: it has its roots in a series of shocks to commodity prices and product market (leading to various sectoral shortages).
While US labour market tightness has not been the main driver of US inflation so far – a research from the Federal Reserve Bank of San Francisco also shows that labour cost dynamics play a modest role in current inflation – Bernanke and Blanchard argue that the inflationary effects of such a tight labour market are more persistent than those of product-market shocks. Tightening monetary policy has therefore a role to play in counteracting these effects, in order to control inflation and push it back to the 2% target by contributing to a better balance between demand and labour supply.
Author

BNP Paribas Team
BNP Paribas
BNP Paribas Economic Research Department is a worldwide function, part of Corporate and Investment Banking, at the service of both the Bank and its customers.


