Euro breaks key support as contagion from political risk grows

Market Overview
The politics of how the US is taking an increasingly belligerent stance across a number of its international relations is having a broadening impact on financial markets. Aside from the escalation of the China trade dispute, the US is looking to impose sanctions on Russia for the chemical weapons attack on the UK, and diplomatic efforts to resolve an issue with Turkey have come to nought. Subsequently the Russian ruble has slumped and the Turkish lira has come under renewed selling pressure. This is having an increased contagion across financial markets now. These increased tensions have all has added up to a stronger dollar, something exacerbated this morning as reports of the ECB being concern by the exposure of Eurozone banks to Turkish debt (which is largely denominated in US dollars). With major bond yields falling across the board, the euro has now broken down below a key floor around $1.1500 against the US dollar. The US Dollar Index has broken sharply above 95.65 to near 12 month highs. Equities are coming under corrective pressure too amidst the safe haven flow. Whilst Donald Trump continues this aggressive approach to US foreign policy, the dollar is strengthening again, something that he will certainly not be liking. Is it time for him to tweet about currency wars or preferring a weaker dollar again perhaps?

Wall Street slipped into the close (S&P 500 -0.1% at 2853) but futures are around -0.4% lower today, leaving Asian markets under pressure into the close (Nikkei -1.3%) and European indices nervously lower in early moves. In forex, there is a decisive safe haven feel as the dollar is stronger across the majors with the one exception of an outperforming yen. The euro is though under the most pressure following the breakdown of the key support. In commodities, the dollar strength is overpowering the safe haven flow for gold which is trading -$5 (c. -0.4%) whilst oil remains under pressure following the downside break earlier in the week.
Today is certainly the most interesting day of the week for economic announcements. With Japanese GDP already out (ahead of expectations at +0.5% for the quarter, when +0.3% had ben expected), the focus is on how the UK’s GDP for the second quarter comes through. Recent months have been showing improved PMIs, and a bounce back in Q2, with the prelim reading of UK GDP for Q2 at 0930BST expected to come in at +0.4% (up from the final reading of 0.2% in Q1. The big focus for traders will though come in the afternoon, with the continuation of US inflation data with US CPI at 1330BST, The headline US CPI is expected to tick higher to top +3.0% for the first time since December 2011 (up from +2.9% in June), whilst core US CPI is expected to remain at +2.3% (+2.3% last month). An upside surprise on the core CPI would be interesting as this would be the highest level since September 2008, having peaked at 2.3% on several occasions during 2016/2017.
Chart of the Day – NZD/USD
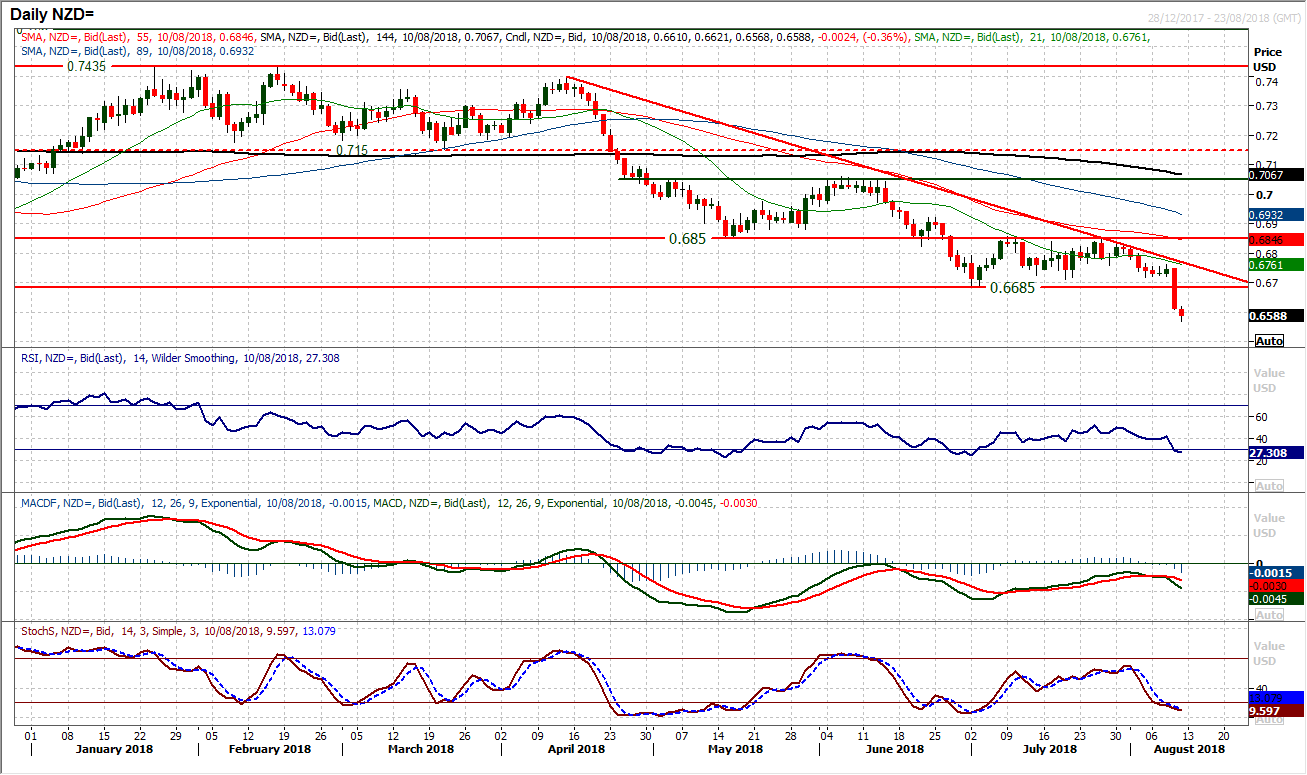
To say that the move from the RBNZ has had an impact on the Kiwi would be an understatement. The surprise dovish move from the central bank has smashed the Kiwi across the major crosses. For NZD/USD the market has been consolidating in a 165 pip range in recent weeks but a massive bear candle has now decisively completed what is a continuation pattern of a consolidation rectangle breakdown. Breaking to a new low dating back around 17 months, the Kiwi has entered into a new phase of selling pressure. The downside break implies 165 pips lower from $0.6685 towards $0.6520 in the coming weeks. Momentum indicators are negatively configured with the RSI only around 30 and still with downside potential as recent key lows have only been seen in the low 20s. The MACD lines have also only just crossed lower again. The huge bear candle has taken the market near term oversold though and well outside the Bollinger Bands, so a snap back could easily be seen (perhaps today). The old breakdown support at $0.6685 is now a basis of resistance with the hourly chart showing initial resistance at $0.6660.
EUR/USD
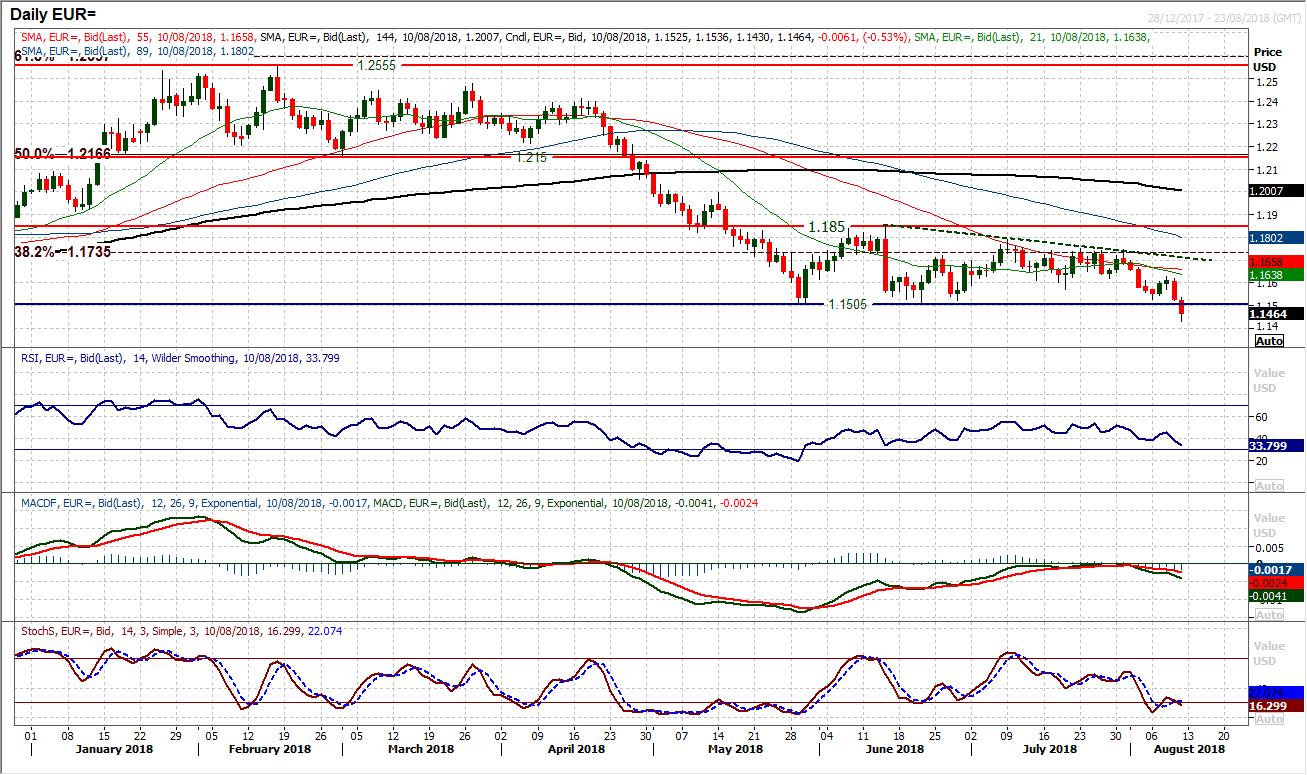
The euro has been smashed overnight as the support of the medium term range has been broken. Yesterday’s strong bear candle cut 80 pips off the price and the market has been testing the $1.1505 key support during the Asian session. However as this support has given way early in the European session the floodgates have been opened with 40/50 pips lost in a matter of minutes. A decisive close below $1.1505 completes a range breakdown and implies around 350 pips of further downside which means $1.1150 is a projected target. With the market around 13 month lows, the next real support is around $1.1310 with an old trading range around $1.1100/$1.1280 a consolidation point. I have been concerned by the roll over in the MACD lines in recent sessions and wit the RSI only in the low 30s there is downside potential in the current move. The $1.1505 old support is a basis of resistance with $1.1505/$1.1570 now a sell zone.
GBP/USD
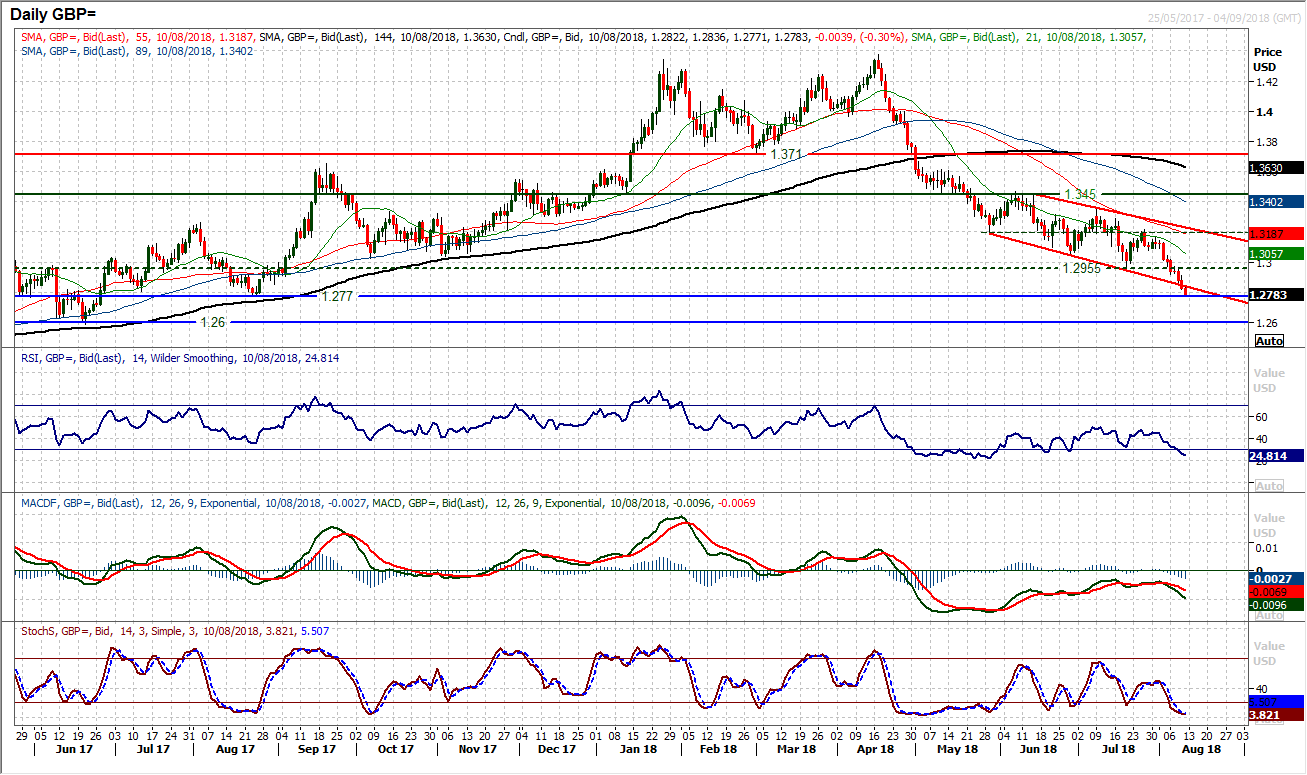
Cable continues to slide as the run of bear candles with negative closes stretches to eight completed sessions. The early prospects of a ninth session are good today too. The trend channel that the market has been pulling lower in for the past 10 weeks is also beginning to breach to the downside as momentum becomes increasingly bearish. Previously within the trend channel, the RSI has bottomed around 30 but the current move is to 25 and with the run of bear candles, the momentum of the move lower does not look ready to stop quite yet. The next support is $1.2770 and is well within reach, whilst beyond there is $1.2600. The hourly chart shows a market negatively configured but with downside potential too still and any intraday rallies are seen as a chance to sell. Old support is new resistance, so $1.2850 becomes an interesting are to watch today, with resistance building between $1.2910/$1.2970.
USD/JPY
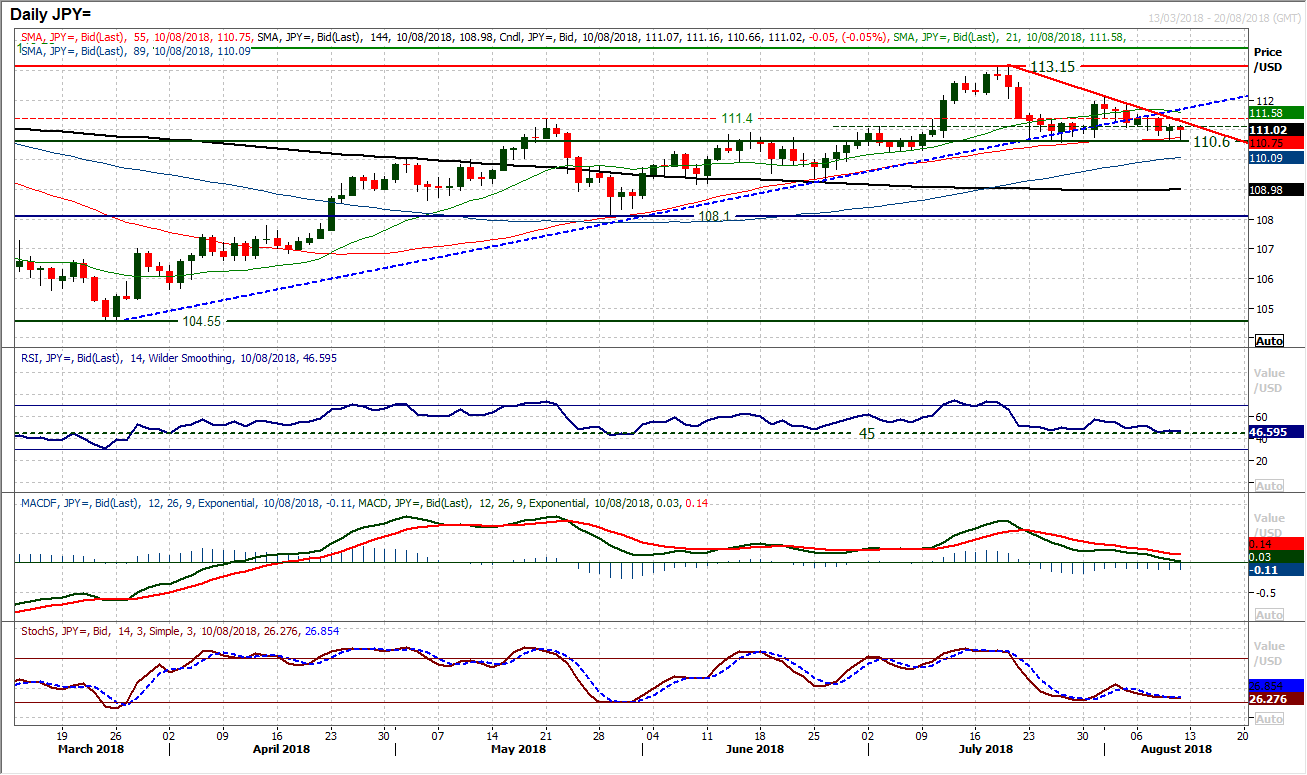
The yen seems to be the one currency holding its own against the dollar right now. Dollar/Yen continues to pull sideways having broken the four month uptrend earlier in the week. However this situation is now coming to a head and a crossroads is being breached. The market has now been in a trend lower for the past three weeks (especially int eh past week and a half where there has been consistent lower highs on almost a daily basis). This has squeezed the market back to the support around 110.60 which is coming under increased pressure. The RSI is again back around 45 and this could be where we see a key move in the market. A close below 110.60 would point to yen strength and 110.25 before 110.00, also changing the outlook. However the dollar bulls are having joy across the majors outside the yen and are fighting to hang on, with the hourly chart suggesting a more neutral configuration. The resistance initially is at 111.15 with 111.50 key near term.
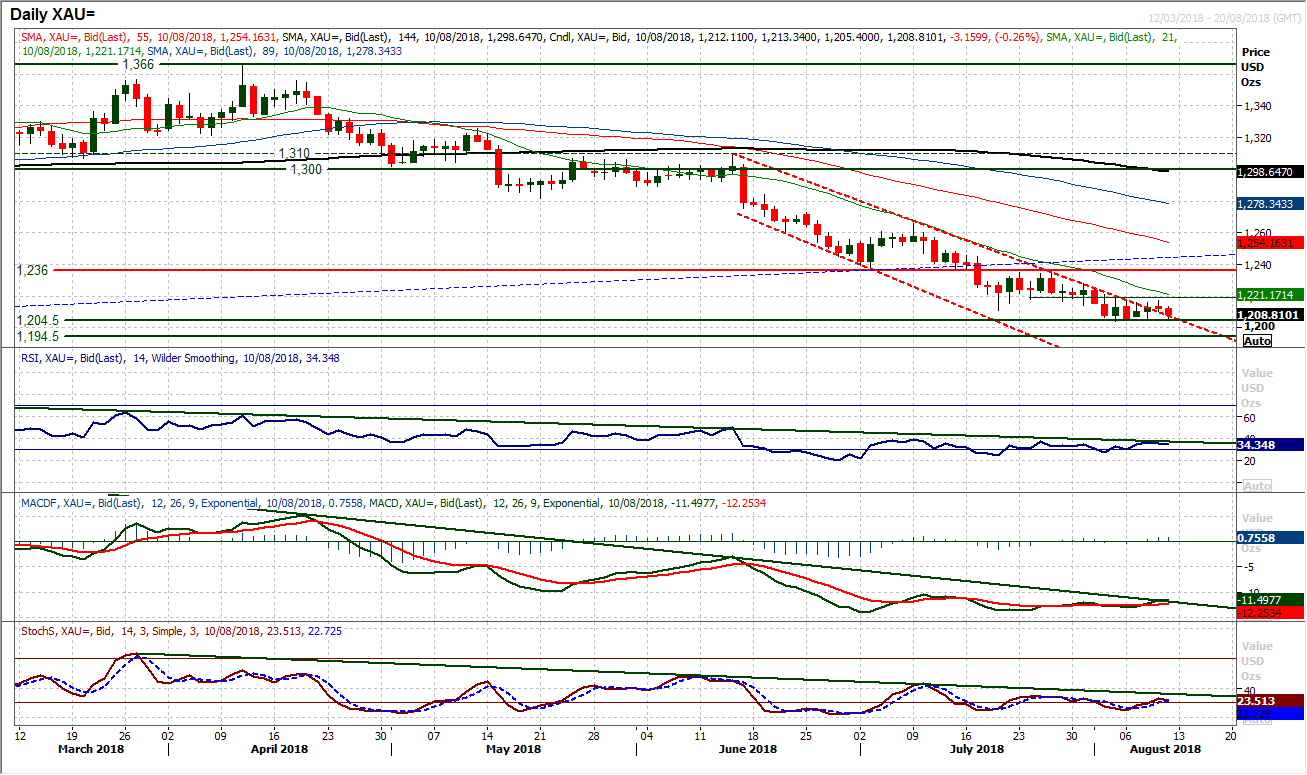
Gold
The gold bulls are fighting to build some sort of recovery but cannot gain the traction. Breaking the seven week downtrend channel earlier this week was encouraging but this is simply a consolidation until resistance can be broken. Initially that means $1220 (on the hurly chart) and $1228. A neutral looking candle yesterday has though been followed by a drop back early today as the dollar has strengthened once more. This has seen the market drop away and another look at the key support at $1204 is building. A closing breach opens $1194.50 which would then be a crucial test for the bulls. The problem for the bulls is also that resistance under $1220 is now growing with yesterday’s high of $1217 effectively a failure. How the bulls respond to this morning’s early decline could be key now.
WTI Oil
A very tepid rebound followed the huge bear candle on Wednesday has done little to improve the prospects for the nervous bulls. Breaking the 11 month uptrend and below the $67 pivot has shifted the sentiment and with momentum indicators increasingly negatively configured again the bears are in the ascendancy. The prospects of a consistent move below the $67 pivot are growing. Although the market scraped a (marginally) positive candle yesterday there was a lack of intent behind the bulls and remains under the old uptrend. A renewed negative candle today with a close below $67 again would really suggest the bulls have lost control and a move back towards the key June low at $63.60 would be open. The hourly chart shows a tentative rebound simply is an unwind of oversold bear momentum and there is a band of resistance $67.40/$68.00 to cap any attempted rally now.

Dow Jones Industrial Average
The Dow continues to consolidate the breakout to multi-month highs earlier in the week as the market slips back once more within the uptrend channel. This sort of move has been seen on several occasions within the channel as corrections continue to be used as a chance to buy. Although the market has slipped for a second consecutive session, the bulls will take increased heart from the fact that the uptrend channel of the past six weeks now comes in today at 25,370 which is effectively at the 61.8% Fibonacci support at 25,367. For now this move is helping to renew upside potential. Momentum indicators remain positively configured (albeit with a degree of consolidation) with the RSI consistently above 60, MACD lines still rising and Stochastics positively configured. It all points towards using the corrections as a chance to buy now and an eventual move higher again within the channel towards the February high at 25,800 and the 76.4% Fib at 25,845. Initial support in the band 25,500/25,587 looks likely to be breached but the 61.8% Fib level would be an idealare to lok for a renewed buy signal. It would need a breach of the channel support, RSI below 60 and bear crosses on MACD and Stochastics to abort this positive outlook now.

Author

Richard Perry
Independent Analyst


