EUR/USD Current price: 1.1318
View Live Chart for the EUR/USD
After opening the week with a firm tone, the American dollar closes this Monday marginally lower across the board. The greenback's gained pace on comments from FED´s Vice Chair Fisher, who stated that the Central Bank is “close to meeting its targets” of full employment and price stability, putting back on the table the possibility of a September rate hike. Also, a weakening yen, due to Kuroda's comments over cutting rates further into negative territory, helped the USD. The market, however, reversed course with London's opening, with no apparent catalyst behind, as the macroeconomic calendar has been empty during the first half of the day.
As for the US, the country released its Chicago FED National activity index, modestly higher in July, up to 0.27 from previous 0.05. Things will be more interesting this Tuesday, with the release of the eurozone flash PMIs for August and housing and manufacturing data coming from the US.
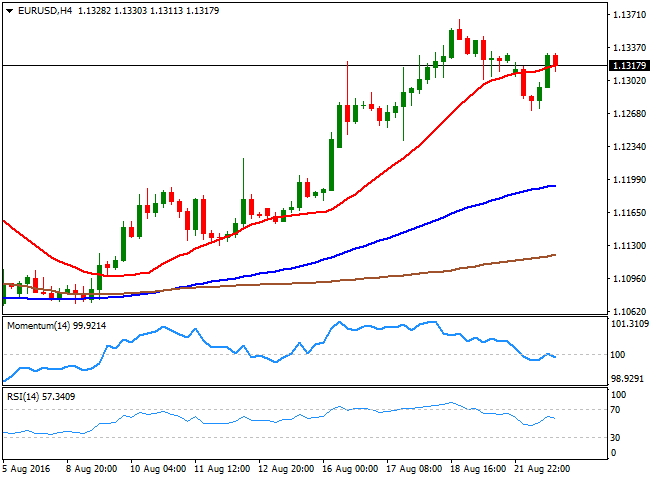
The EUR/USD pair trades near its daily high of 1.1330 ahead of the Asian opening, holding on to its recent gains and generally bullish, despite the lack of action seen this Monday has left technical readings within neutral levels. Still, in the 4 hours chart, the price is a couple of pips above a bullish 20 SMA and far above the 100 and 200 SMAs, whilst the technical indicators hover around their midlines, showing no upward strength at the time being. Still, the pair can extend its rally up to the 1.1360 region, last week highs, with a break above it supporting a continued advance up to 1.1460, a major static resistance level.
Support levels: 1.1265 1.1230 1.1190
Resistance levels: 11320 1.1360 1.1400
EUR/JPY Current price: 113.48
View Live Chart for the EUR/JPY
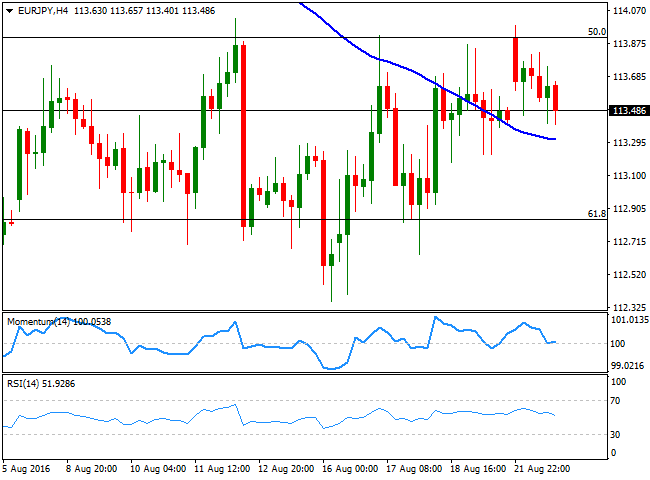
An early advance in the EUR/JPY pair, amid broad yen's weakness, was contained by selling interest around the top of the recent range around 114.00, the 50% retracement of the post-Brexit bullish run. The EUR/JPY pair has been trading in a Fibonacci-defined range for most of this August, with slides contained around 112.80, the 61.8% retracement of the mentioned rally. The market will keep on gyrating around the USD and the possibility of a sooner rate hike this week, with attention focused in the Jackson Hole Symposium, in where Janet Yellen will speak on economic policy. In the meantime, the short term technical picture for the pair is mostly neutral, as in the 1 hour chart, the price is holding above a slightly bullish 100 SMA, while the technical indicators head south within negative territory. In the 4 hours chart, technical readings present a neutral stance, with the Momentum indicator flat around its 100 level, and the RSI heading lower within positive territory, as the price holds above a horizontal 100 SMA.
Support levels: 113.15 112.80 112.40
Resistance levels: 113.75 114.05 114.40
GBP/USD Current price: 1.3132
View Live Chart for the GBP/USD
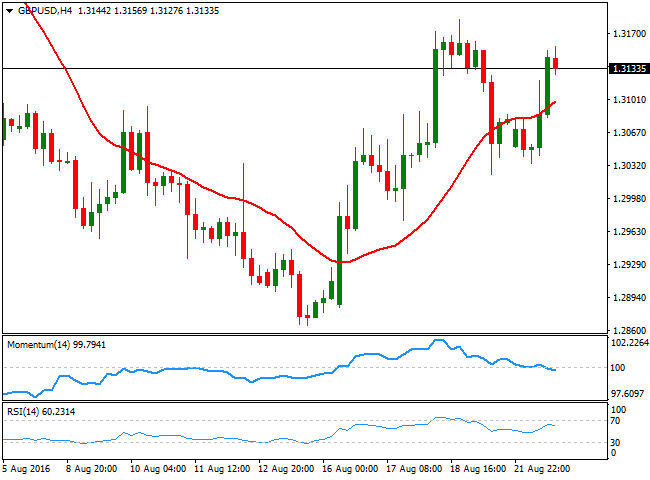
The GBP/USD pair recovered from a daily low of 1.3033 achieved on dollar's early demand, having rallied up to 1.3156 to settle around 1.3130 at the end of the US session. There were no macroeconomic news coming from the UK and in fact, there will be no relevant releases until next Friday, when the kingdom will publish its preliminary Q2 GDP figures. The Pound however, surged on diminishing fears over the economic consequences of the Brexit, following much better-than-expected data released last week. Technically, the upside is favored as in the 1 hour chart, the price is now above a bullish 20 SMA, currently around 1.3055, while technical indicators extended their advance within positive territory, now at fresh daily highs. In the 4 hours chart, the price is also above a now bullish 20 SMA, although the technical indicators have turned lower, with the RSI indicator losing upward strength around 60 and the Momentum indicator heading lower below its 100 level and limiting chances of a stronger rally. Nevertheless, the upside remains favored, with an acceleration above the mentioned daily high required to confirm a retest of the 1.3200 region.
Support levels: 1.3090 1.3060 1.3030
Resistance levels: 1.3160 1.3190 1.3230
USD/JPY Current price: 100.28
View Live Chart for the USD/JPY
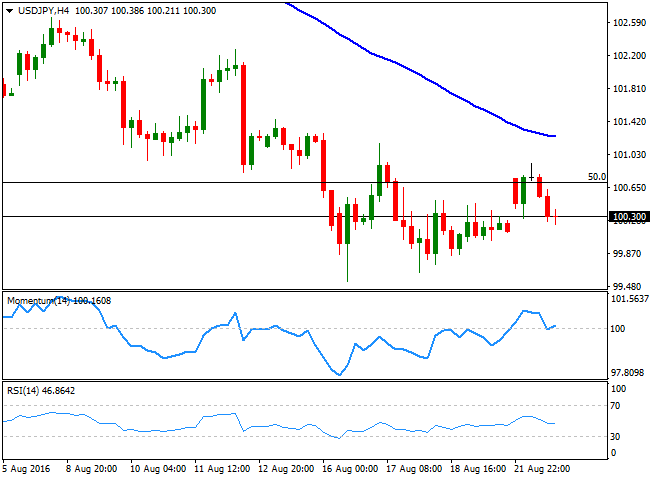
The USD/JPY pair failed to regain the upside, trimming most of its early gains during the US afternoon. The Japanese yen opened lower, undermined by comments from BOJ's Governor Kuroda, who said that the Central Bank won't hesitate to cut rates further into negative territory. Nevertheless, the market is uncertain over the possibility of a September cut, and even do, of the effects that such measure may have over the economy or the yen. The pair advanced intraday up to 100.93, but quickly reversed course, to settle a handful of pips above the 100.00 level, and at risk of a bearish breakout. Short term, the 1 hour chart shows that the pair was rejected by selling interest around a bearish 200 SMA, while is now hovering around a horizontal 100 SMA, and while the technical indicators hold within bearish territory, with no clear directional strength. In the 4 hours chart, the price remains well below its moving averages, with the 100 SMA now around 101.25, and indicators bouncing modestly from their mid-lines, but lacking strength, leaving the pair mostly neutral.
Support levels: 100.20 99.90 99.55
Resistance levels: 100.65 100.95 101.30
AUD/USD Current price: 0.7626
View Live Chart for the AUD/USD
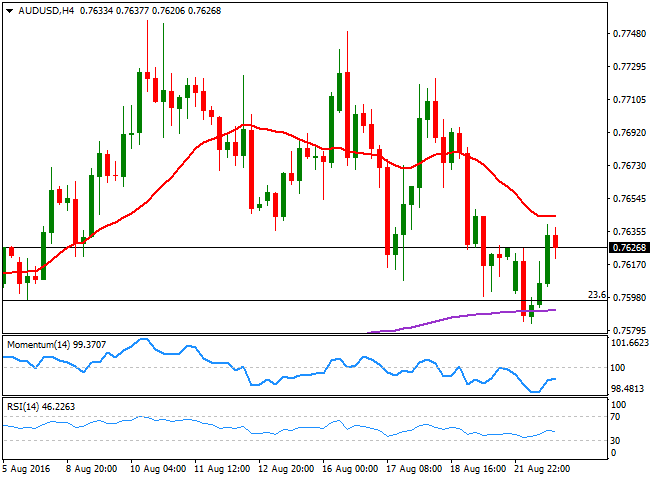
The AUD/USD pair fell down to 0.7583, a fresh 3-week low, but recovered back above the 0.7600 level after the greenback changed course during the European morning. The pair however, is far from the 0.7700 level seen last week, with the Aussie losing the bullish momentum seen during the July/ early August. Australia released the Conference Board Leading Economic Index up by 0.1% in June, matching previous month reading and hardly affecting the pair. The intraday advanced extended up to 0.7639, with the pair now retreating modestly from the level. Technically, the 1 hour chart shows that the price is above a horizontal 20 SMA, while the technical indicators consolidate within positive territory, far from suggesting further gains ahead. In the 4 hours chart, however, the upside looks limited, as the 20 SMA stands a few pips above the mentioned daily high, while the technical indicators recovered from overbought readings, but lost upward strength and are currently turning lower within negative territory.
Support levels: 0.7600 0.7570 0.7540
Resistance levels: 0.7640 0.7690 0.7735
Information on these pages contains forward-looking statements that involve risks and uncertainties. Markets and instruments profiled on this page are for informational purposes only and should not in any way come across as a recommendation to buy or sell in these assets. You should do your own thorough research before making any investment decisions. FXStreet does not in any way guarantee that this information is free from mistakes, errors, or material misstatements. It also does not guarantee that this information is of a timely nature. Investing in Open Markets involves a great deal of risk, including the loss of all or a portion of your investment, as well as emotional distress. All risks, losses and costs associated with investing, including total loss of principal, are your responsibility. The views and opinions expressed in this article are those of the authors and do not necessarily reflect the official policy or position of FXStreet nor its advertisers. The author will not be held responsible for information that is found at the end of links posted on this page.
If not otherwise explicitly mentioned in the body of the article, at the time of writing, the author has no position in any stock mentioned in this article and no business relationship with any company mentioned. The author has not received compensation for writing this article, other than from FXStreet.
FXStreet and the author do not provide personalized recommendations. The author makes no representations as to the accuracy, completeness, or suitability of this information. FXStreet and the author will not be liable for any errors, omissions or any losses, injuries or damages arising from this information and its display or use. Errors and omissions excepted.
The author and FXStreet are not registered investment advisors and nothing in this article is intended to be investment advice.
Recommended Content
Editors’ Picks
EUR/USD holds above 1.0700 ahead of US jobs report

EUR/USD stays in a consolidation phase above 1.0700 after closing the previous two days in positive territory. Investors eagerly await April jobs report from the US, which will include Nonfarm Payrolls and Unemployment Rate readings.
GBP/USD advances to 1.2550, all eyes on US NFP data

The GBP/USD pair trades on a stronger note around 1.2550 amid the softer US Dollar on Friday. Market participants refrain from taking large positions as focus shifts to April Nonfarm Payrolls and ISM Services PMI data from the US.
Gold remains stuck near $2,300 ahead of US NFP

Gold price struggles to gain any meaningful traction and trades in a tight channel near $2,300. The Fed’s less hawkish outlook drags the USD to a multi-week low and lends support to XAU/USD ahead of the key US NFP data.
XRP edges up after week-long decline as Ripple files letter in reply to SEC’s motion

Ripple filed a letter to the court to support its April 22 motion to strike new expert materials. The legal clash concerns whether SEC accountant Andrea Fox's testimony should be treated as a summary or expert witness.
US NFP Forecast: Nonfarm Payrolls gains expected to cool in April

The NFP report is expected to show that the US economy added 243,000 jobs last month, sharply lower than the 303,000 job creation seen in March. The Unemployment Rate is set to stay unchanged at 3.8% in the same period.