EUR/USD trades in a narrow range of sideways movement as the market trend awaits for confirmation
-
The EUR/USD pair rebounds from last week's lows and approached key resistance.
-
The indicator for the moving average (MA) displays a negative sign for the near term.
-
The momentum oscillator (RSI) holds onto a natural zone with a decline in momentum.
EUR/USD traded in a narrow sideways range during the initial European session. The major currency pairs couldn’t make any meaningful moves on the previous day. At press time, EUR/USD traded at 1.0715, down 0.02% on a daily basis.
4-hour candlestick graph
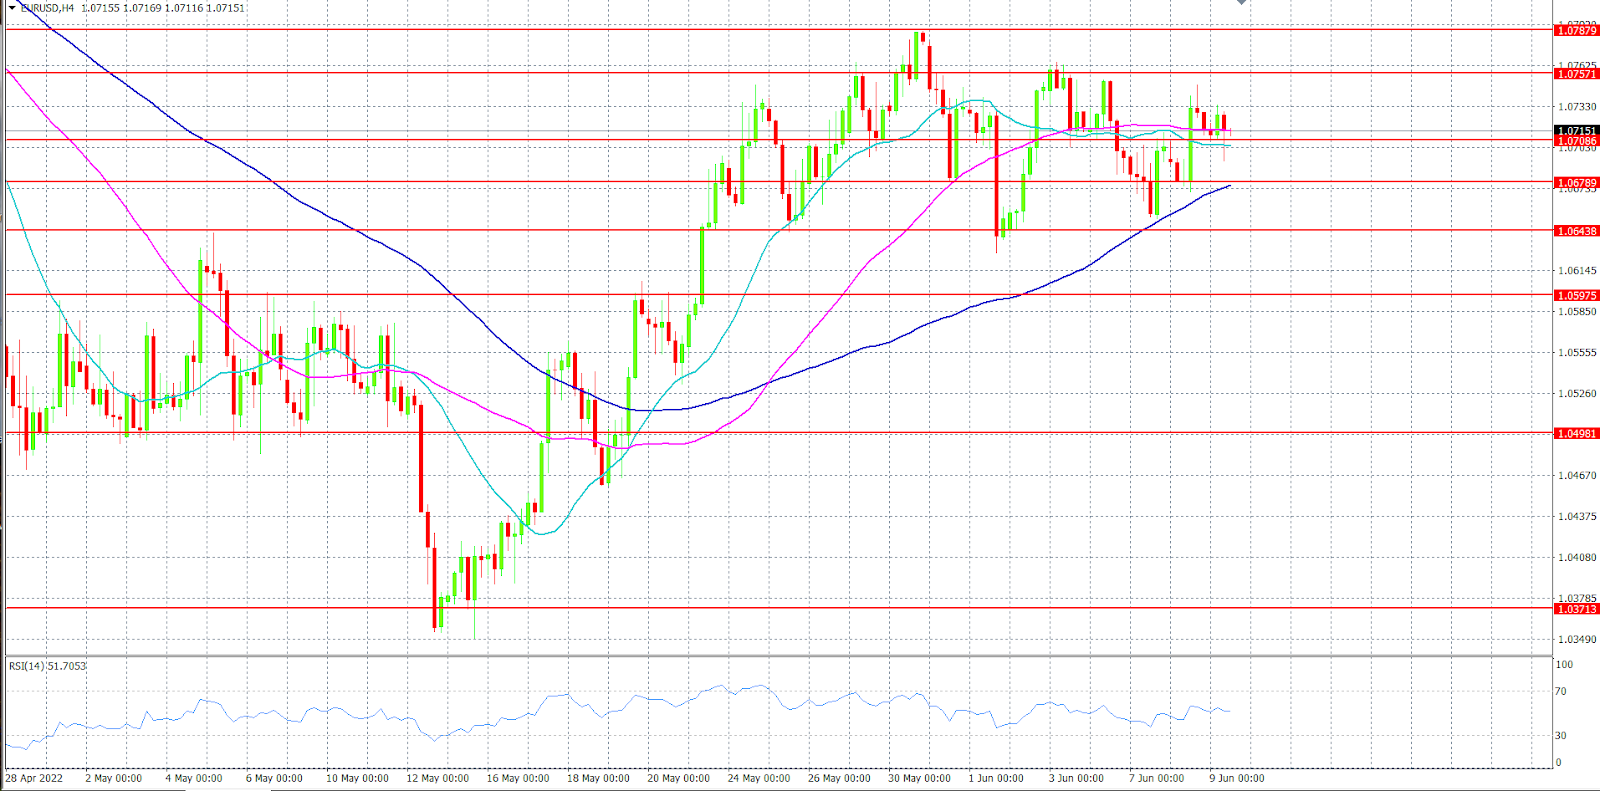
This Outlook Relies on a Four-Hour Timeframe
However, EUR/USD clings to the 1.0708 support level after falling from yesterday's high level of 1.0731. Furthermore, the crucial resistance level of 1.0751 has been elusive since June 3rd, keeping the European currency trading at the current levels.
On the 4-hour chart, the 21-period crosses below the 50-period on the Moving Average (MA) indicators, which suggests a downside trend in the near term. Meanwhile, the Relative Strength Index (RSI) 51.78 records 51.78 on the value line with a decrease in momentum. Any uptick would support the buying power and vice versa.
On the other hand, the market participants should wait for a trend confirmation, while the support level of 1.0708 holds price from falling as the resistance level of 1.0751 holds the price from further gains.
The aforementioned support and resistance levels are the keys to predictions of the possible next step that is more likely to occur. Consequently, sellers would wait for a divisive breach of the 1.0708 hurdle. a successful close below that level for the 4-hour candlestick would pave the way towards the 1.0678 support level. Below that level, market participants' eyes would be on 1.0653, the low of June 3rd.
On the flip side, if EUR/USD wants to make further gains, it should succeed in conquering the 1.0751 hurdle. Subsequent to a decisive breach of the aforementioned level, traders would target the 1.0787 resistance level, followed by the 1.0816 resistance level.
Author

Mohammad Quqas
Independent Analyst
Mohammad Quqas has a bachelor's degree in finance and banking. He has been trading forex for years, which has given him expertise in working with foreign currencies, commodities, and indices.


