EUR/USD Current price: 1.0973
View Live Chart for the EUR/USD
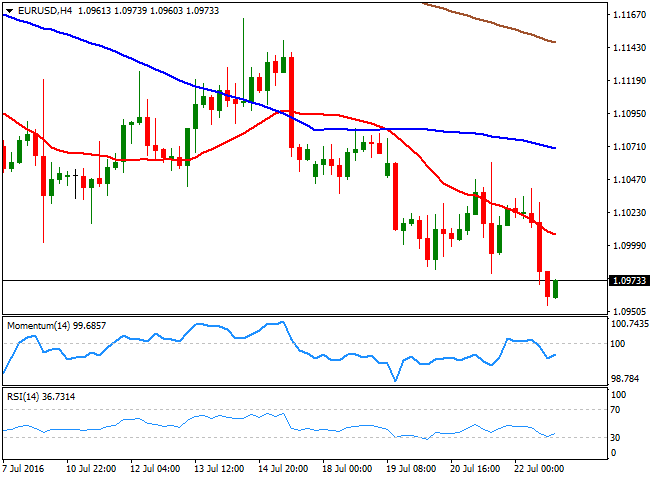
The EUR/USD pair posted its lowest daily close in four months last Friday, ending the day below the 1.1000 level. Volatility was quite limited last week, but the American dollar stood as the overall winner, in spite hopes of massive stimulus coming from Central Banks diminished. The ECB left its economic policy unchanged, while BOJ's Kuroda ruled out "helicopter money" several times during these last few days. Hopes now turn to the upcoming FED's meeting this week, expected to be hawkish, given the latest batch of positive US data reaffirming the US economy has picked up in the second quarter.
European data was generally positive, with advanced EU PMIs for July stronger-than-expected, with even French manufacturing up, from 48.3 to 48.6, although still within contraction territory. In Germany, the manufacturing PMI slipped from 54.5 to 53.7 and the services PMI rose from 53.7 to 54.6, while for the whole region, manufacturing printed 51.9, below market's expectations and the services PMI came in at 52.7. US preliminary July manufacturing PMI came in at 52.9, much better than the previous 51.3 or the 51.6 expected.
As for the technical picture of the pair, the daily chart shows that it has been unable to recover above a bearish 20 SMA that maintains a strong bearish slope, currently in the 1.1060 region, after crossing below the 100 and 200 SMAs, in line with further slides. Also, technical indicators in the mentioned time frame have turned lower within negative territory, with the RSI indicator at fresh July lows. In the 4 hours chart, the pair is also below its moving averages that maintain bearish slopes, but the technical indicators hold flat within bearish levels, rather reflecting the lack of directional momentum than suggesting downward exhaustion. The pair has a strong support at 1.0910, the post-Brexit low, with a break below it opening doors for a steeper decline down to the 1.0800/40 region, a major long term support area.
Support levels: 1.0955 1.0910 1.0840
Resistance levels: 1.1020 1.1060 1.1100
EUR/JPY Current price: 116.46
View Live Chart for the EUR/JPY
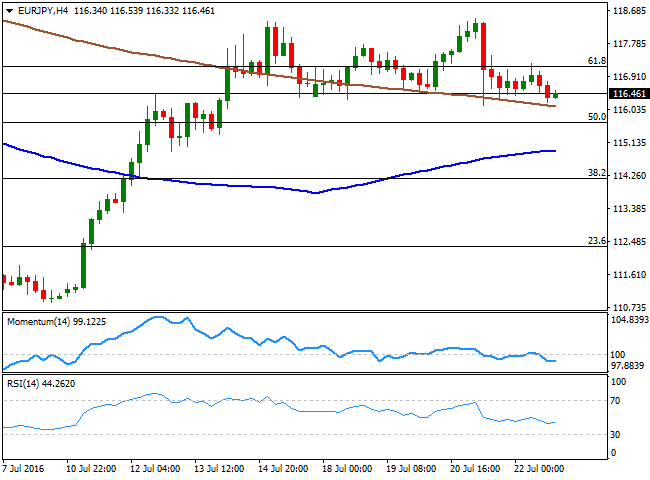
The EUR/JPY pair closed the week marginally lower at 116.46, with the Japanese yen recovering partially market's favor, on speculation that the recent decline of the currency, based on speculation of upcoming fiscal and monetary stimulus as soon as this month, has exceeded BOJ's real intentions. Further weighed by EUR's weakness, the technical outlook for the pair is not yet confirming a downward continuation, as in the daily chart, the price keeps hovering around the 61.8% retracement of the post-Brexit slump, around 117.20, while the Momentum indicator is barely retreating within overbought territory, while the RSI indicator heads south around 51. Still, the upside seems well-limited, with the 100 and 200 SMAs maintaining their bearish slopes well above the current level. In the 4 hours chart, the price is holding above a bearish 200 SMA, now around 116.10, while the technical indicators lack directional strength within negative territory, in line with the longer term perspective. The pair needs to break below the 115.60 region to confirm a steeper decline that can extend down to 114.10, the 38.2% retracement of the mentioned slide.
Support levels: 116.10 115.60 115.15
Resistance levels: 116.60 117.20 117.75
GBP/USD Current price: 1.3101
View Live Chart for the GBP/USD
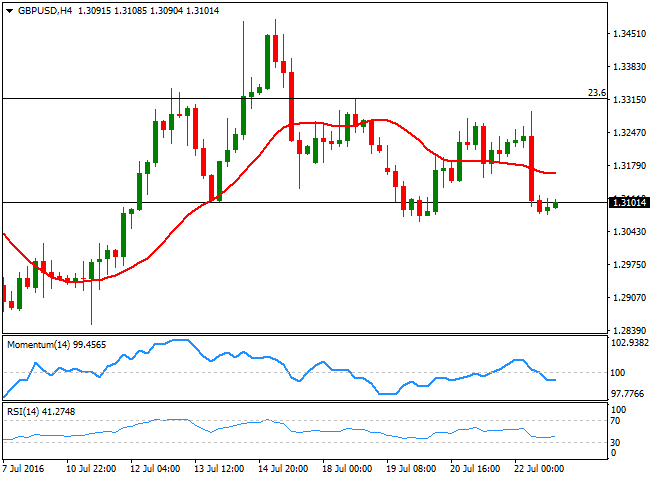
The GBP/USD pair closed the week in the red around the 1.3100 level, weighed last Friday by preliminary PMIs readings, showing that the UK plummeted into contraction zone. Markit published one-off flash PMIs for the kingdom, with data collected after the referendum, which came in worse-than-expected, even despite forecasts were already meaningfully negative. The services number result at 47.4 from previous 52.3, while the manufacturing sector fell down to 49.1 from previous 52.1, indicating the UK is now in contraction territory, as a result of the uncertainty surrounding the decision of leaving the EU. The daily chart shows that the price was contained by the 23.6% retracement of its latest daily decline at 1.3320, and that the pair closed below its 20 SMA, while the Momentum indicator holds flat within positive territory, but that the RSI indicator heads lower around 40, all of which indicates that the risk remains towards the downside. However, it also seems that the pair has found a comfort zone around the 1.3000 figure, and that a break below the key psychological level would take a huge catalyst. Shorter term, and according to the 4 hours chart, the pair presents a neutral-to-bearish stance, as the price is below a flat 20 SMA, while the technical indicators lack directional strength, but hold within negative territory.
Support levels: 1.3065 1.3020 1.2980
Resistance levels: 1.3130 1.3165 1.3200
USD/JPY Current price: 106.13
View Live Chart for the USD/JPY
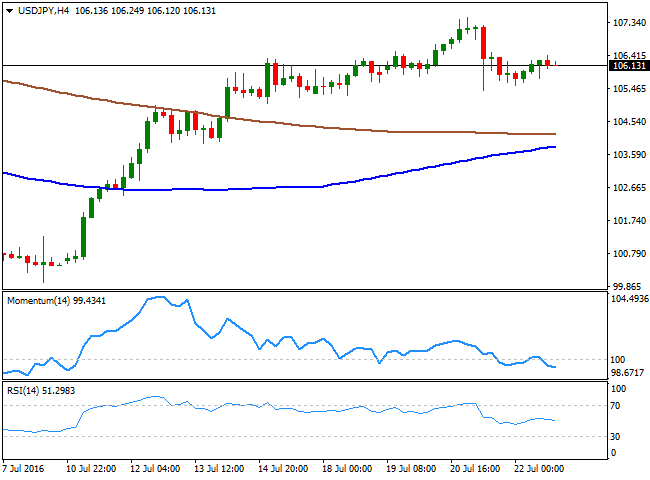
After topping at 107.48, the USD/JPY pair closed the week with modest gains at 106.13, as investors rushed to take profits out ahead of the upcoming BOJ's meeting, next July 29th. Abe's victory in the latest elections fueled speculation that the Japanese Government was getting ready to launch massive stimulus, both fiscal and monetary, resulting in the JPY plummeting against all of its major rivals. But BOJ's Governor Haruhiko Kuroda denied the possibility of implementing "helicopter money," even despite reaffirming that the central bank is prepared to step up stimulus if needed. Market is expecting the BOJ to cut rates further into negative territory, down to -0.2% from current -0.1% this week. The pair closed the week off its high, but according to the daily chart, the bullish tone persists, as the Momentum indicator keeps heading north in overbought territory, while the RSI turned higher after a limited downward correction within positive territory. Still, the 100 SMA in the mentioned time frame stands at the mentioned high, becoming a critical breakout point to confirm a new leg higher this week. In the 4 hours chart, the pair has lost its bullish tone, as despite the price is firmly above its 100 and 200 SMAs, the technical indicators have turned lower within negative territory, suggesting the pair may extend further its decline, particularly on a break below 105.40.
Support levels: 105.80 105.40 105.05
Resistance levels: 106.60 107.10 107.50
AUD/USD Current price: 0.7465
View Live Chart for the AUD/USD
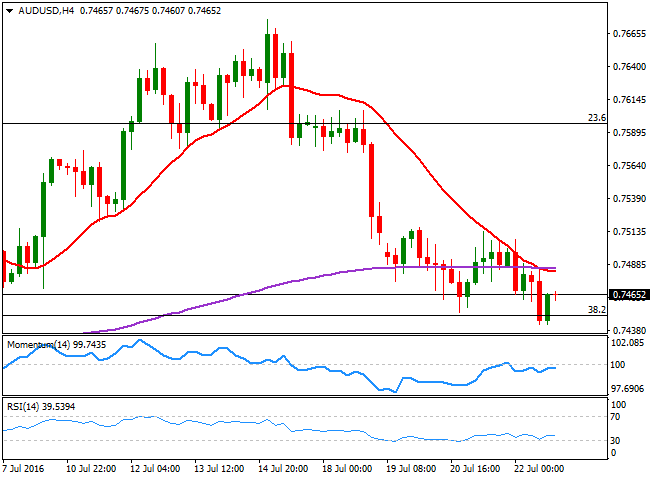
The AUD/USD pair closed last week at 0.7465 after posting a fresh 2-week low of 0.7442 in the American afternoon, ahead of the release of Australian second quarter CPI next Wednesday. Speculation that the RBA may provide another rate cut in August, if underlying inflation continues to fall should keep the Aussie in the negative side. Year-on-year trimmed inflation for the second quarter is expected to have fallen to 1.5% from previous 1.7%. A reading below expected should support the bearish case for the pair. Technically, the daily chart shows that price posted a shallow bounce from a critical support, 0.7450, the 38.2% retracement of this year's rally, and also that the price is developing below its 20 SMA, while the technical indicators have turned south, entering negative territory and maintaining bearish slopes, supporting some further slides ahead. In the 4 hours chart, the price is below its 20 SMA, while the technical indicators hold below their mid-lines, also indicating that the risk is towards the downside.
Support levels: 0.7450 0.7410 0.7370
Resistance levels: 0.7490 0.7540 0.7590
Information on these pages contains forward-looking statements that involve risks and uncertainties. Markets and instruments profiled on this page are for informational purposes only and should not in any way come across as a recommendation to buy or sell in these assets. You should do your own thorough research before making any investment decisions. FXStreet does not in any way guarantee that this information is free from mistakes, errors, or material misstatements. It also does not guarantee that this information is of a timely nature. Investing in Open Markets involves a great deal of risk, including the loss of all or a portion of your investment, as well as emotional distress. All risks, losses and costs associated with investing, including total loss of principal, are your responsibility. The views and opinions expressed in this article are those of the authors and do not necessarily reflect the official policy or position of FXStreet nor its advertisers. The author will not be held responsible for information that is found at the end of links posted on this page.
If not otherwise explicitly mentioned in the body of the article, at the time of writing, the author has no position in any stock mentioned in this article and no business relationship with any company mentioned. The author has not received compensation for writing this article, other than from FXStreet.
FXStreet and the author do not provide personalized recommendations. The author makes no representations as to the accuracy, completeness, or suitability of this information. FXStreet and the author will not be liable for any errors, omissions or any losses, injuries or damages arising from this information and its display or use. Errors and omissions excepted.
The author and FXStreet are not registered investment advisors and nothing in this article is intended to be investment advice.
Recommended Content
Editors’ Picks
EUR/USD clings to gains above 1.0750 after US data

EUR/USD manages to hold in positive territory above 1.0750 despite retreating from the fresh multi-week high it set above 1.0800 earlier in the day. The US Dollar struggles to find demand following the weaker-than-expected NFP data.
GBP/USD declines below 1.2550 following NFP-inspired upsurge

GBP/USD struggles to preserve its bullish momentum and trades below 1.2550 in the American session. Earlier in the day, the disappointing April jobs report from the US triggered a USD selloff and allowed the pair to reach multi-week highs above 1.2600.
Gold struggles to hold above $2,300 despite falling US yields

Gold stays on the back foot below $2,300 in the American session on Friday. The benchmark 10-year US Treasury bond yield stays in negative territory below 4.6% after weak US data but the improving risk mood doesn't allow XAU/USD to gain traction.
Bitcoin Weekly Forecast: Should you buy BTC here? Premium

Bitcoin (BTC) price shows signs of a potential reversal but lacks confirmation, which has divided the investor community into two – those who are buying the dips and those who are expecting a further correction.
Week ahead – BoE and RBA decisions headline a calm week

Bank of England meets on Thursday, unlikely to signal rate cuts. Reserve Bank of Australia could maintain a higher-for-longer stance. Elsewhere, Bank of Japan releases summary of opinions.