EUR/USD Forecast: Further advances remain in the pipeline
- EUR/USD alternated gains with losses around 1.0900.
- The US Dollar ended Tuesday’s session barely changed.
- The Economic Sentiment in Germany worsened in July.

The US Dollar (USD) regained some balance after stronger-than-expected Retail Sales, although that initial upside impetus ran out of steam as the NA session drew to a close on Tuesday.
Against that backdrop, the USD Index hovered around the low-104.00s, while EUR/USD managed to regain composure and reclaimed the 1.0900 neighbourhood following an earlier drop to the area below that round level.
The inconclusive price action around spot came amidst further demand for the fixed-income space on both sides of the ocean, resulting in the acceleration of the downtrend in US and German yields across various timeframes.
Meanwhile, the macroeconomic landscape remained stable. Investors generally expect the European Central Bank (ECB) to keep its policy rate unchanged at its July 18 meeting, though markets still anticipate two additional cuts by the end of the year.
Conversely, there is ongoing debate among investors about whether the Fed will implement one, two, or three rate cuts this year, despite the Fed's current projection of a single cut, likely in December.
Furthermore, the CME Group's FedWatch Tool fully priced in lower rates at the September 18 meeting.
The ECB's rate cut in June, coupled with the Fed's decision to maintain rates, has widened the policy divergence between the two central banks, potentially leading to further weakening of EUR/USD in the short term.
However, economic recovery prospects in the Eurozone, along with signs of cooling in key US economic indicators, may mitigate this disparity and occasionally support the pair in the near future, a view that appears to have regained poise on the back of rising expectations of rate cuts by the Fed.
Looking ahead, upcoming US data coupled with Fedspeak and the ECB event should remain the key drivers of the pair’s price action in the short-term horizon at least.
EUR/USD daily chart
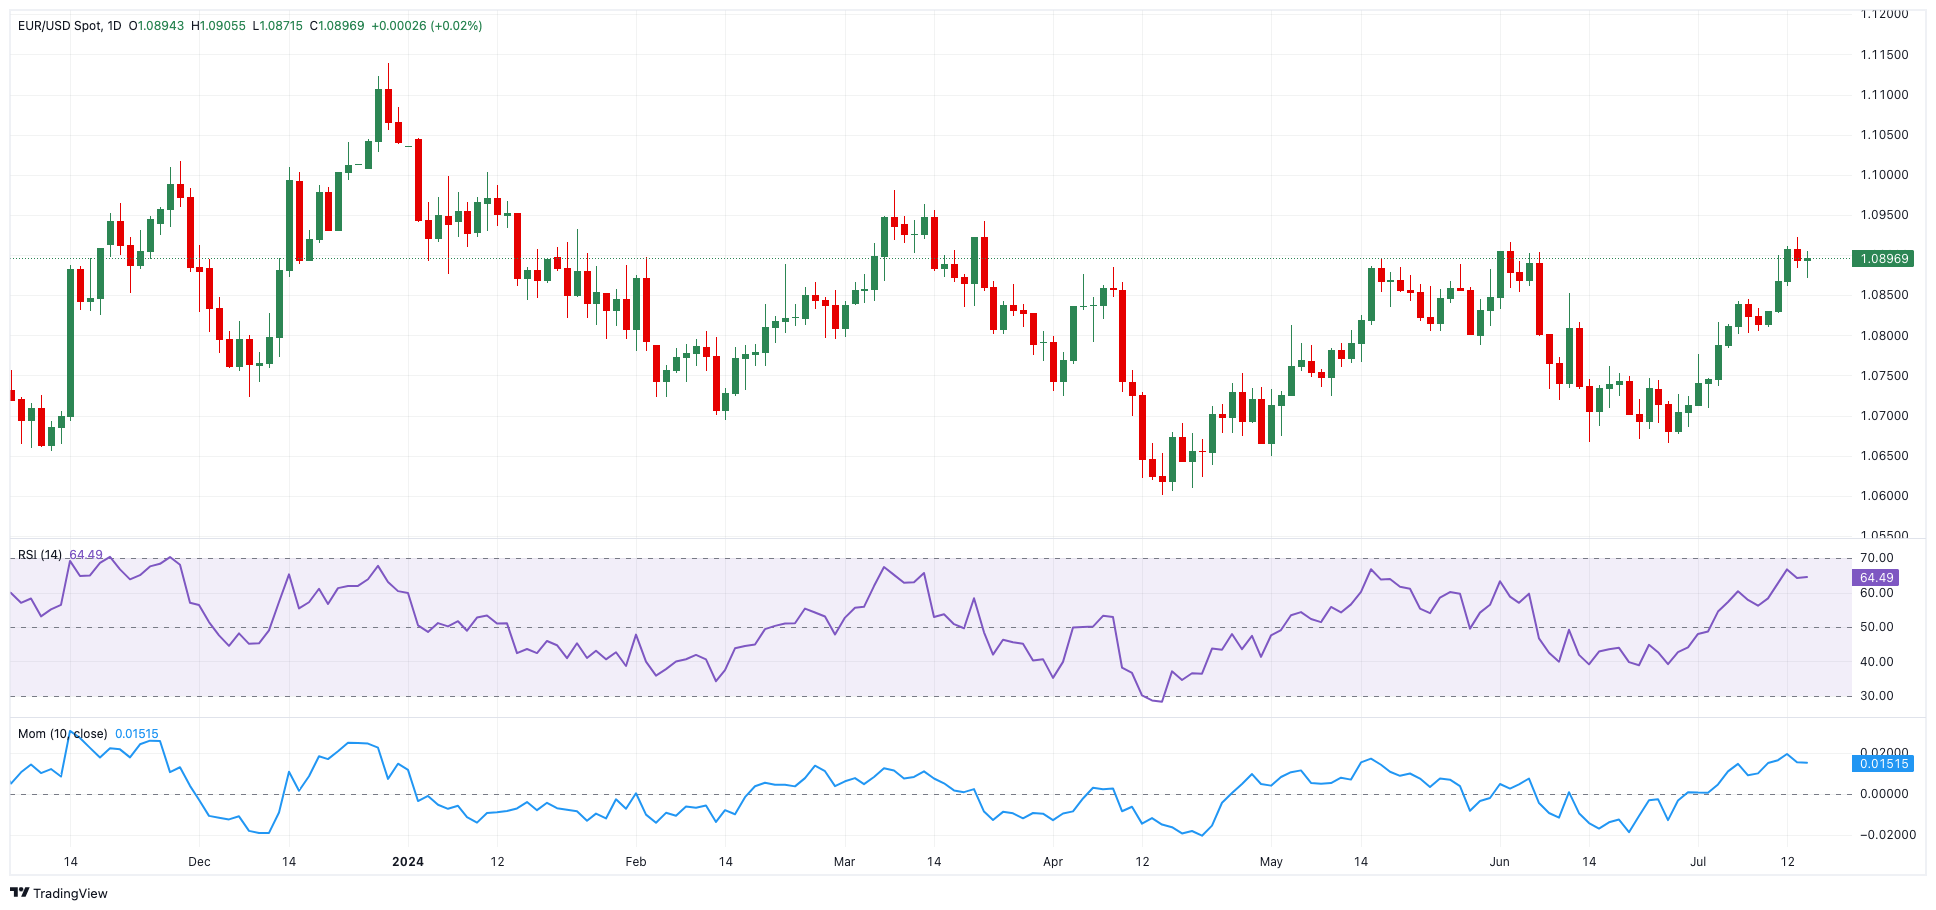
EUR/USD short-term technical outlook
EUR/USD is expected to meet the next upward hurdle at 1.0922 (July 15), followed by the March peak of 1.0981 (March 8) and the psychological 1.1000 barrier.
If bears seize control, spot may touch the 200-day SMA of 1.0806 before sliding to the June low of 1.0666 (June 26). From here, the loss of the May low of 1.0649 (May 1) leads to the 2024 bottom of 1.0601 (April 16).
Looking at the broader picture, it looks that more gains are in the works if the crucial 200-day SMA is continuously breached.
So far, the 4-hour chart indicates that some consolidative fashion might have kicked in. The initial resistance level is 1.0922, which comes ahead of 1.0981. On the other hand, the 55-SMA at 1.0847 comes first, followed by the 200-SMA at 1.0788, and lastly 1.0709. The RSI (relative strength index) rose to around 60.
Author

Pablo Piovano
FXStreet
Born and bred in Argentina, Pablo has been carrying on with his passion for FX markets and trading since his first college years.


