EUR/USD Forecast: EUR/USD pressures 1.1000 after disappointing US CPI

EUR/USD Current price: 1.1014
- The United States core Consumer Price Index rose by more than anticipated in August.
- Market participants reduced bets of a 50 basis points Federal Reserve’s cut next week.
- EUR/USD bounced from near 1.1000 but the risk is still to the downside.
The EUR/USD pair heads into the United States (US) opening trading near a fresh four-week low of 1.1002, as the US Dollar surged following the release of Consumer Price Index (CPI) figures. The US CPI rose by 2.5% on a yearly basis in August, easing from 2.9% in July, while the core annual figure printed at 3.2%, unchanged from the previous month, according to the US Bureau of Labor Statistics (BLS).
Moreover, the core monthly index increased by 0.3%, higher than the 0.2% advance anticipated. The figures diluted hopes for an upcoming 50 basis points (bps) interest rate cut from the Federal Reserve (Fed) next week and spurred risk aversion. As a result, the USD is up against most major rivals.
Falling stocks add to the picture ahead of the European Central Bank (ECB) monetary policy decision. The ECB is widely anticipated to announce a second 25 bps rate cut on Thursday, with the focus then on any forward guidance.
EUR/USD short-term technical outlook
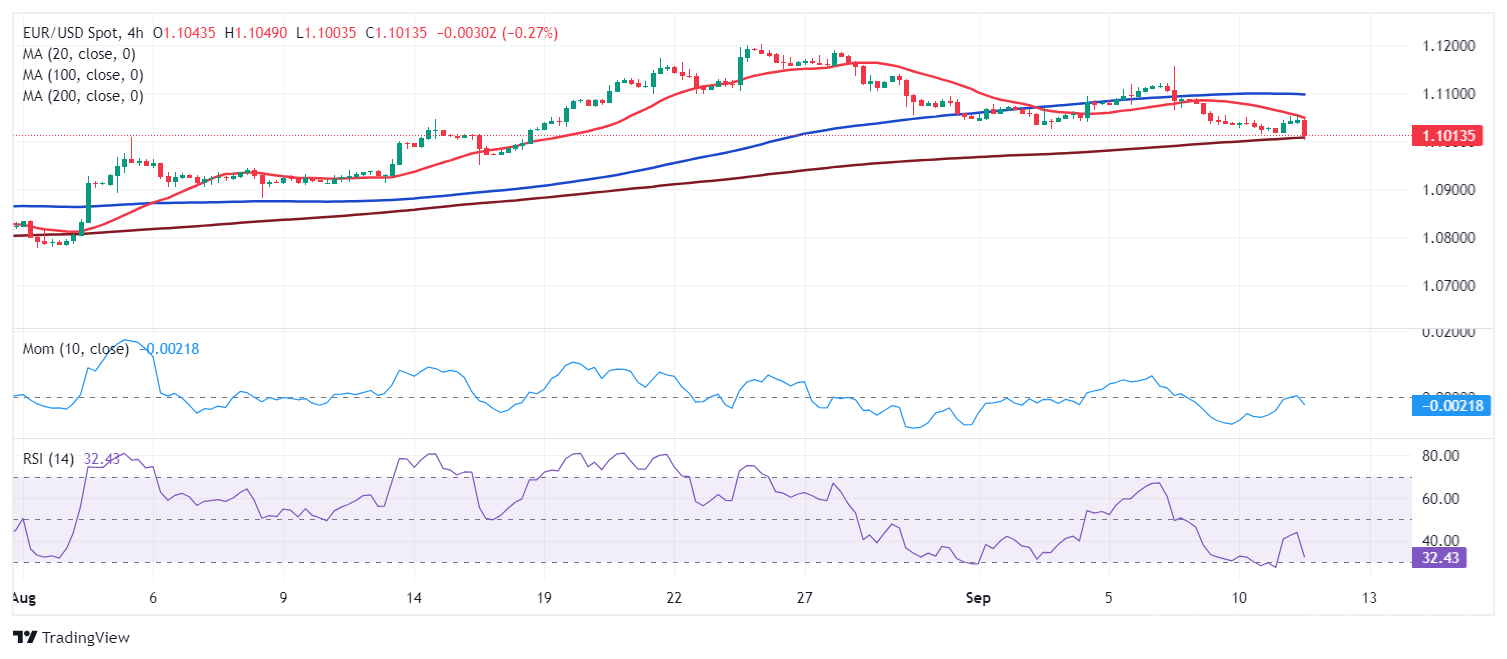
The EUR/USD pair is down for a fourth consecutive day, and the negative momentum will likely continue. In the daily chart, the 20 Simple Moving Average (SMA) has turned flat at around 1.1090, reinforcing a static resistance area. The longer moving averages remain over 150 pips below the current level, with only the 100 SMA showing modest upward strength. Finally, technical indicators lack directional strength but remain below their midlines, in line with another leg south.
In the near term, and according to the 4-hour chart, the risk skews to the downside. The pair met sellers around a bearish 20 SMA, which continues to accelerate south below a now flat 100 SMA. At the same time, EUR/USD is pressuring a mildly bullish 200 SMA for the first time in over a month. Finally, technical indicators head firmly south within negative levels, reflecting sellers’ strength.
Support levels: 1.0990 1.0950 1.0910
Resistance levels: 1.1050 1.1090 1.1140
(This story was corrected on September 11 at 13:25 GMT to clarify that US core inflation was higher than anticipated month-over-month, and not the headline reading.)
Premium
You have reached your limit of 3 free articles for this month.
Start your subscription and get access to all our original articles.
Author

Valeria Bednarik
FXStreet
Valeria Bednarik was born and lives in Buenos Aires, Argentina. Her passion for math and numbers pushed her into studying economics in her younger years.


